Présentation
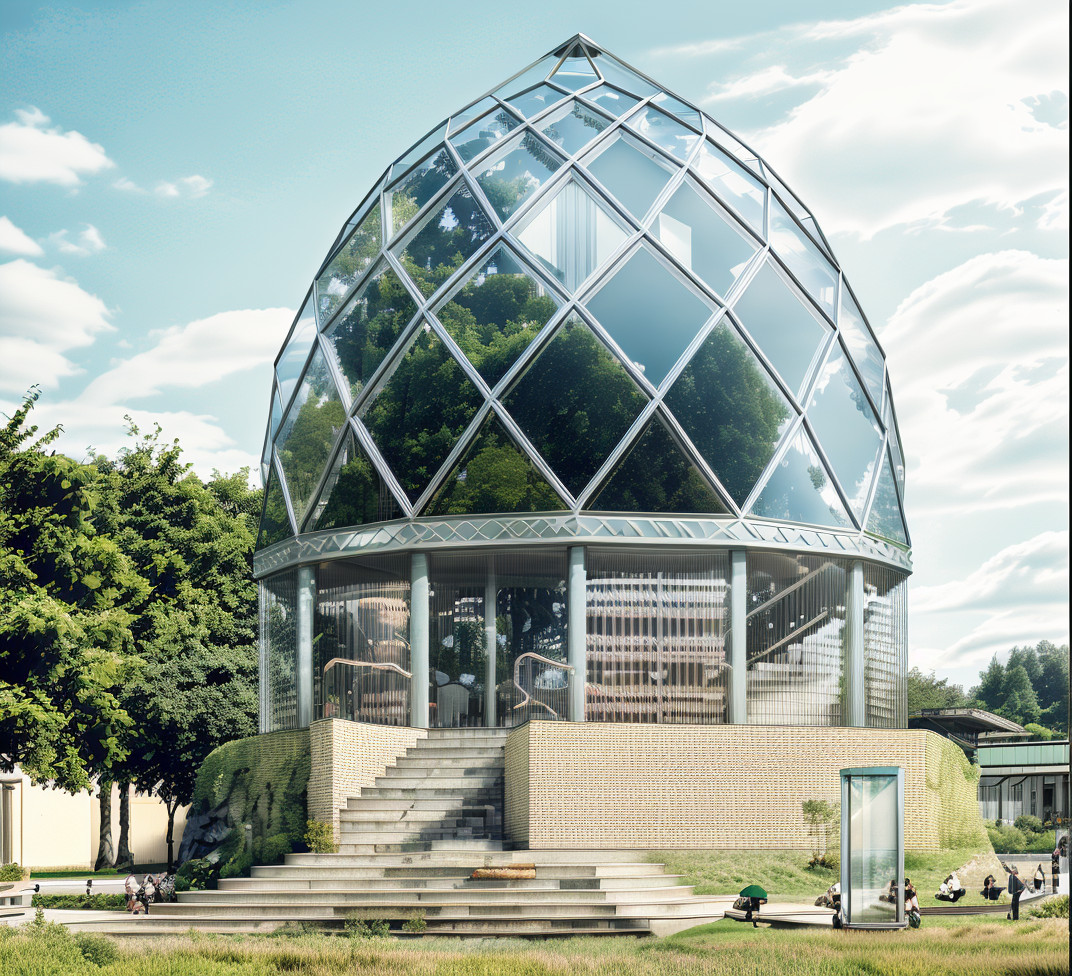
The Glass Pavilion designed by Bruno Taut! It was a stunning prismatic glass dome structure built for the 1914 Cologne Deutscher Werkbund Exhibition. This pavilion showcased innovative construction materials and techniques, while also highlighting how glass could be utilized to evoke emotions and construct a spiritual utopia.
The Glass Pavilion had a complex geometric structure composed of a faceted dome formed by numerous flat quadrangular glass panes. The glass panes were fixed into an iron framework that featured a steel compression ring at the base to create a stable and secure foundation.
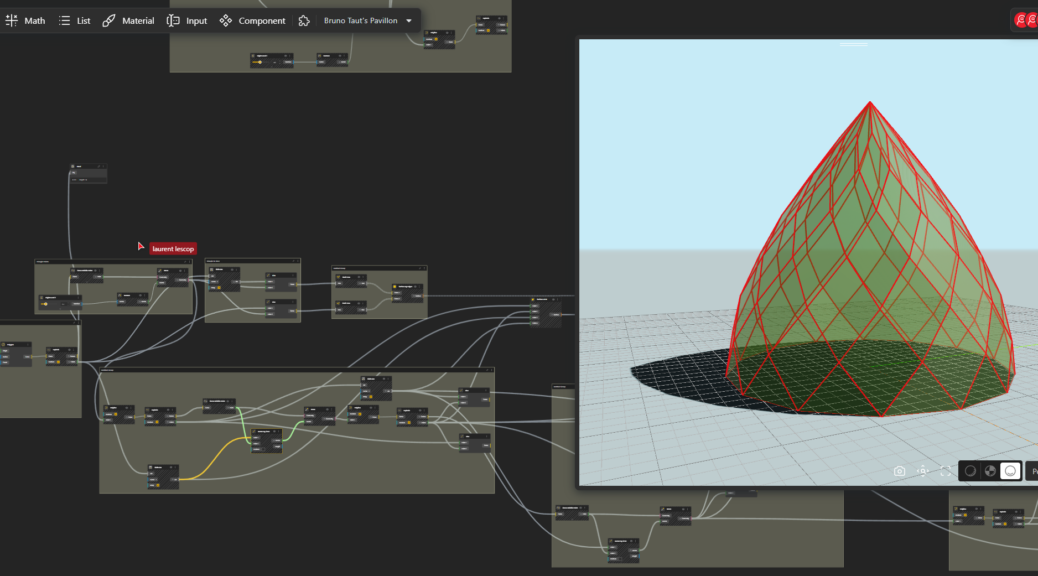
Understanding the geometric construction of such shapes necessitates a comprehensive grasp of the underlying structure, beyond the optical illusion it presents. It is crucial to recognize that the entire design originates from a preliminary shape. Subsequently, through translation and rotation, the upper panes are derived. Factors such as the shape, size, and heights are determined by various parameters, including the number of sides and the height of the initial triangles. This complexity and the multitude of possible outcomes make a parametric model highly suitable for exploring the various design options.
We will use Beegraphy, the online Grasshopper for that. https://beegraphy.com/
BeeGraphy is an innovative cloud-based platform tailored for computational designers. It provides effortless cross-platform compatibility, removing the requirement for installations, thereby facilitating seamless usage on Windows, Mac, or Linux systems. By enabling model creation directly in the cloud and allowing easy sharing through a straightforward URL link, BeeGraphy fosters real-time collaboration and co-creation among individuals and teams. Beegraphy ensures that you can share your parametric models securely without disclosing the underlying script, empowering to present designs confidently. Additionally, Beegrapgy offers the opportunity to showcase and market models in Beegraphy online store, generating passive income.
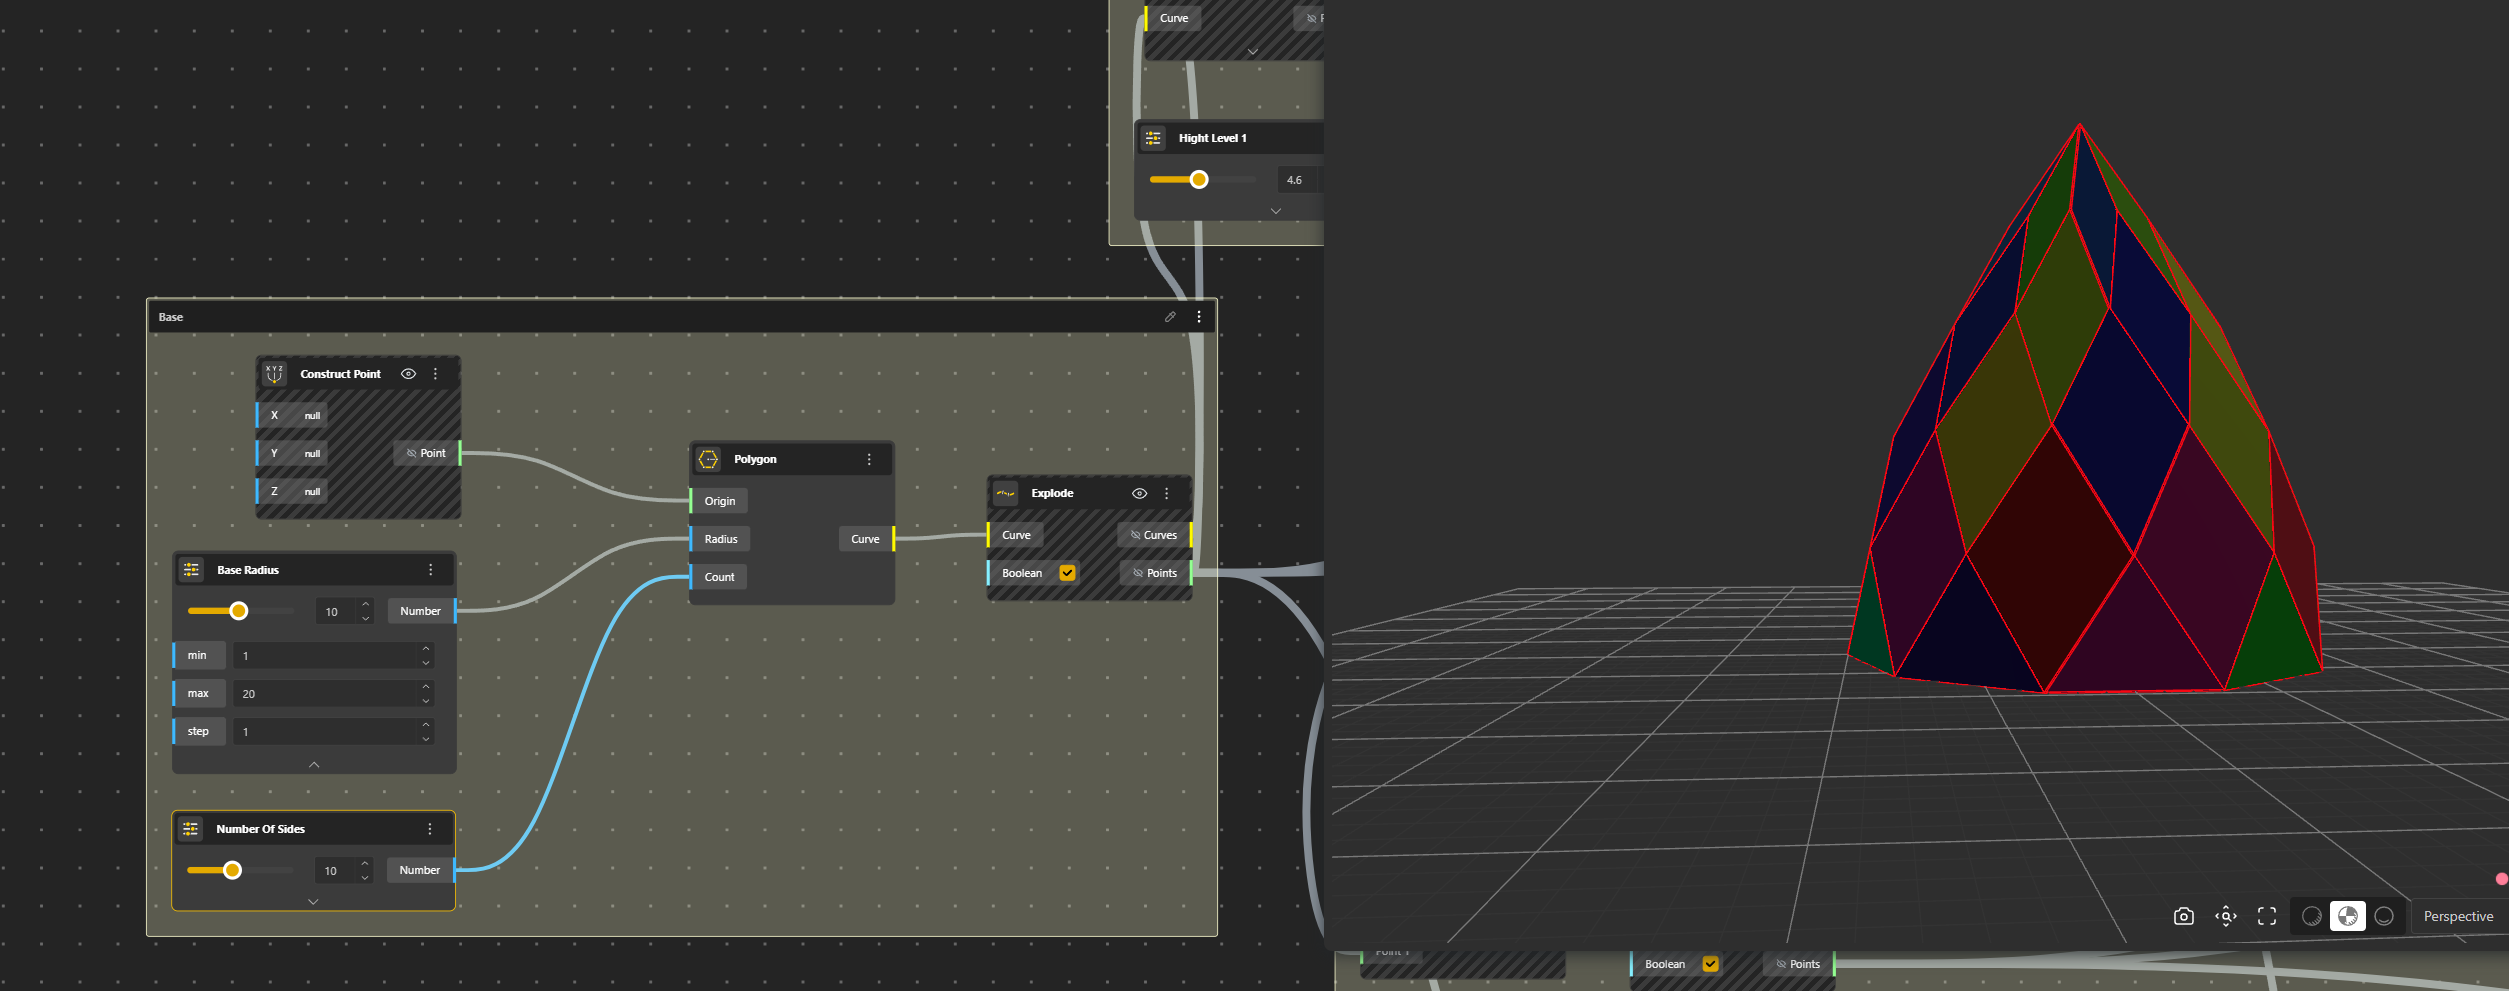
Settting the base
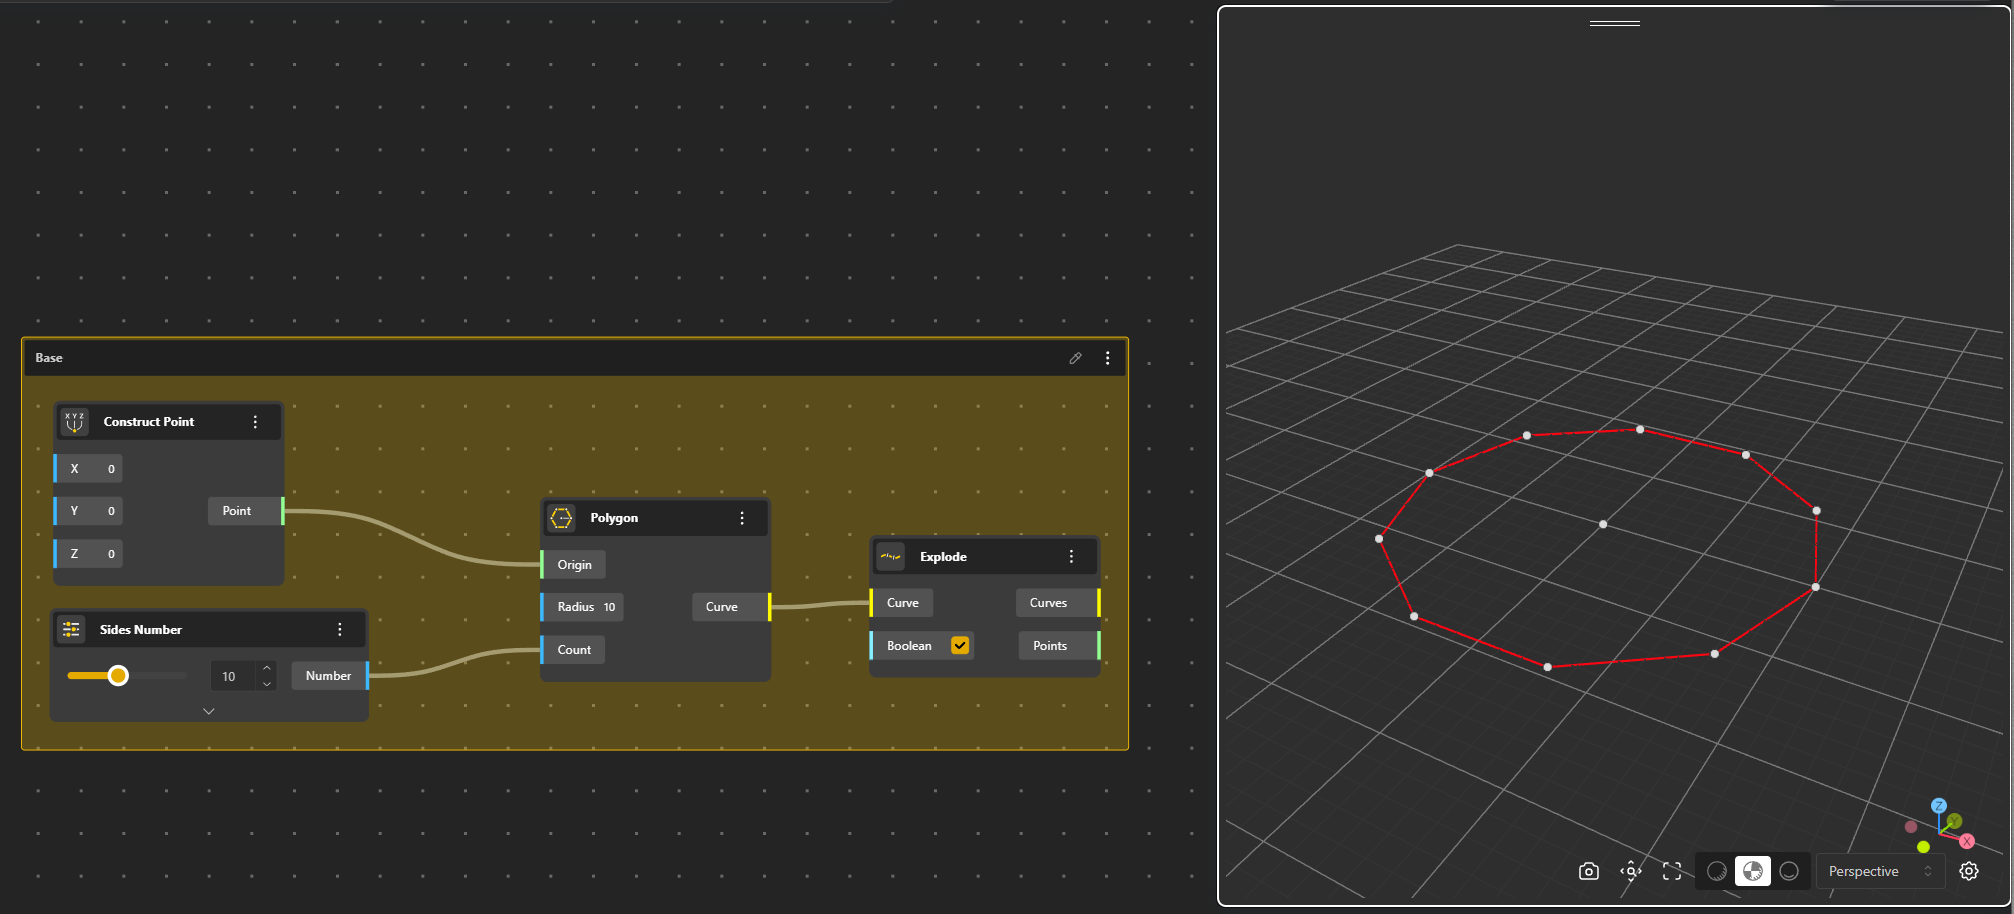
We start by creating a Point (Construct Point), then a Polygone on which we add a Range Input. We rename this Range Input Sides Number for a better use in the further interface. We then Explode the Polygone to have separate segments.
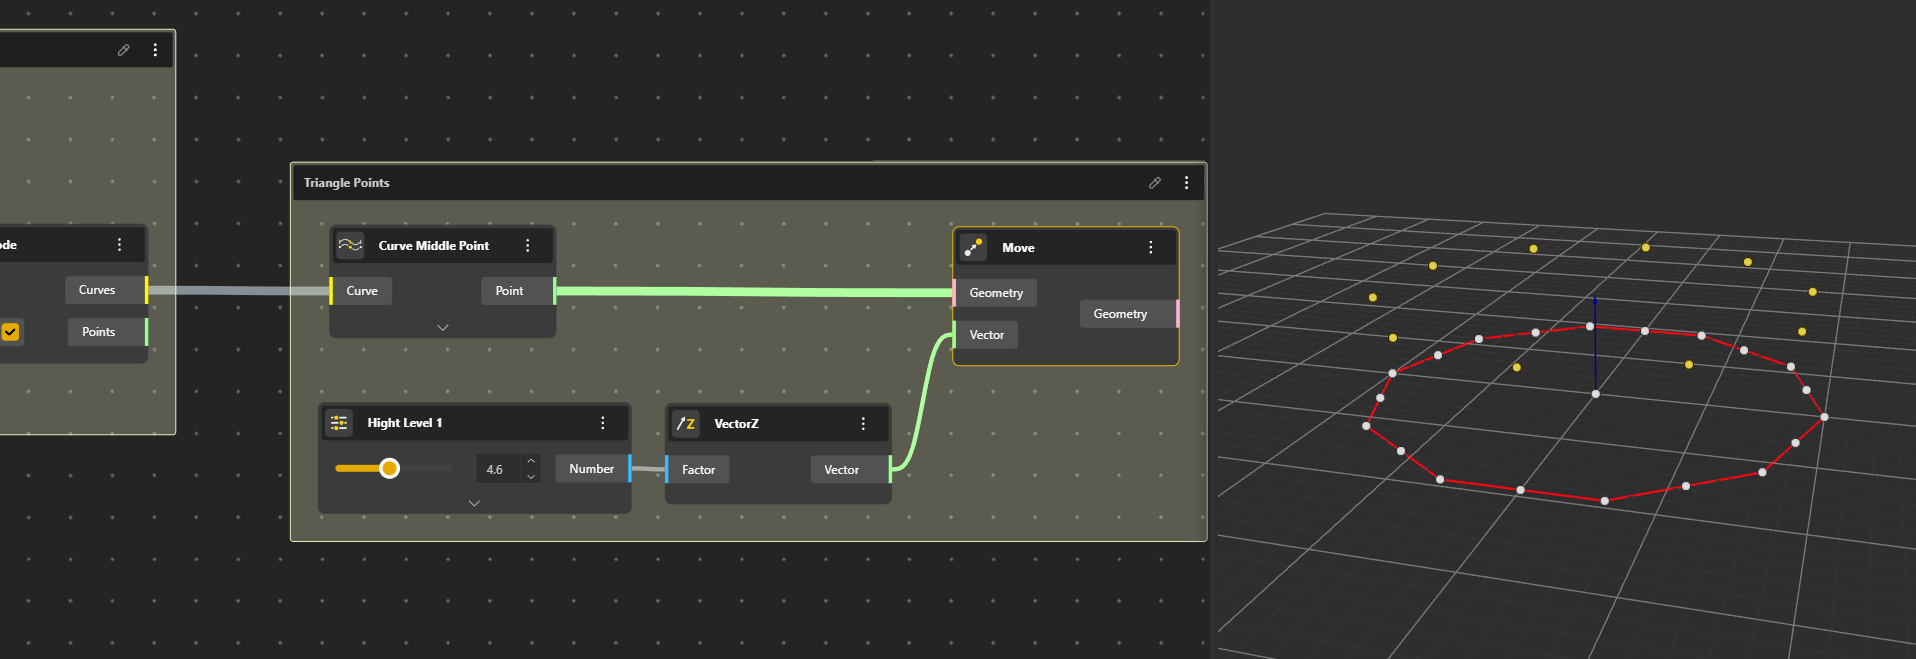
First row of triangles
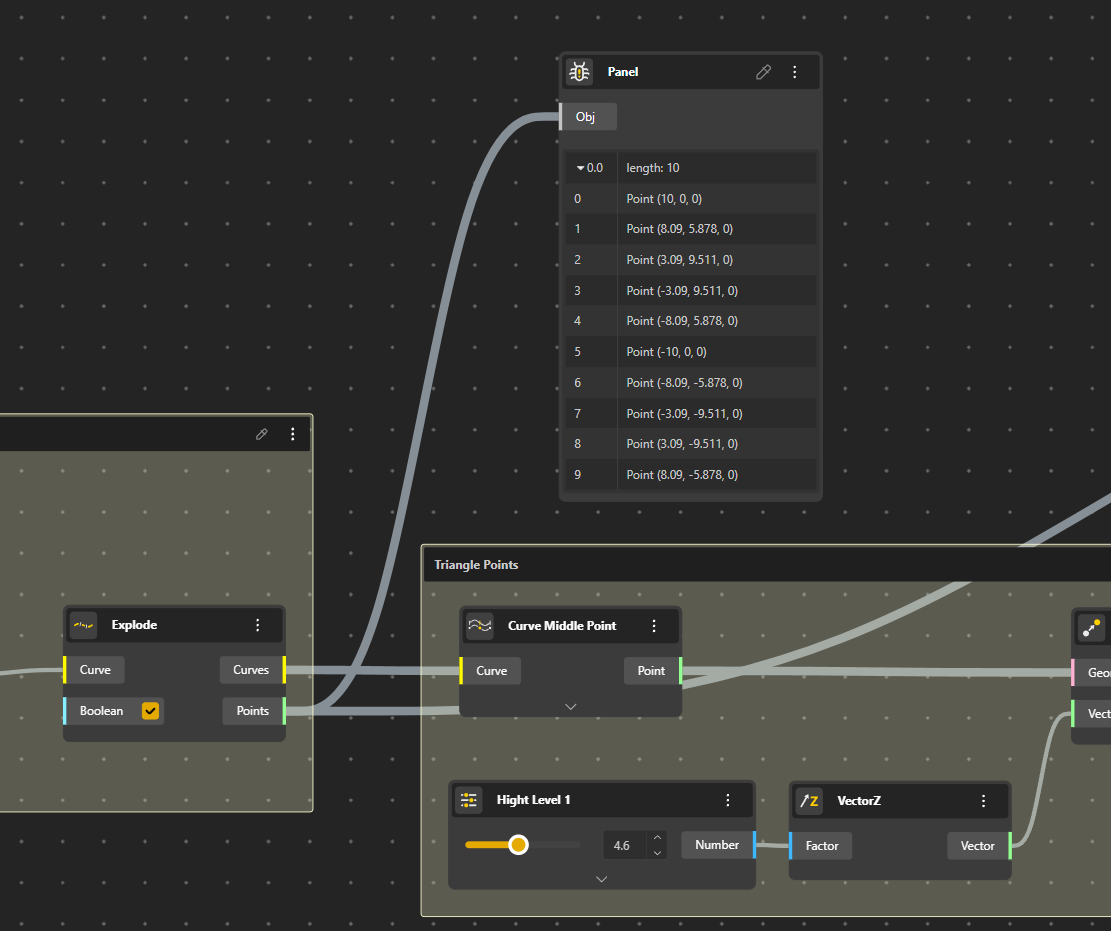
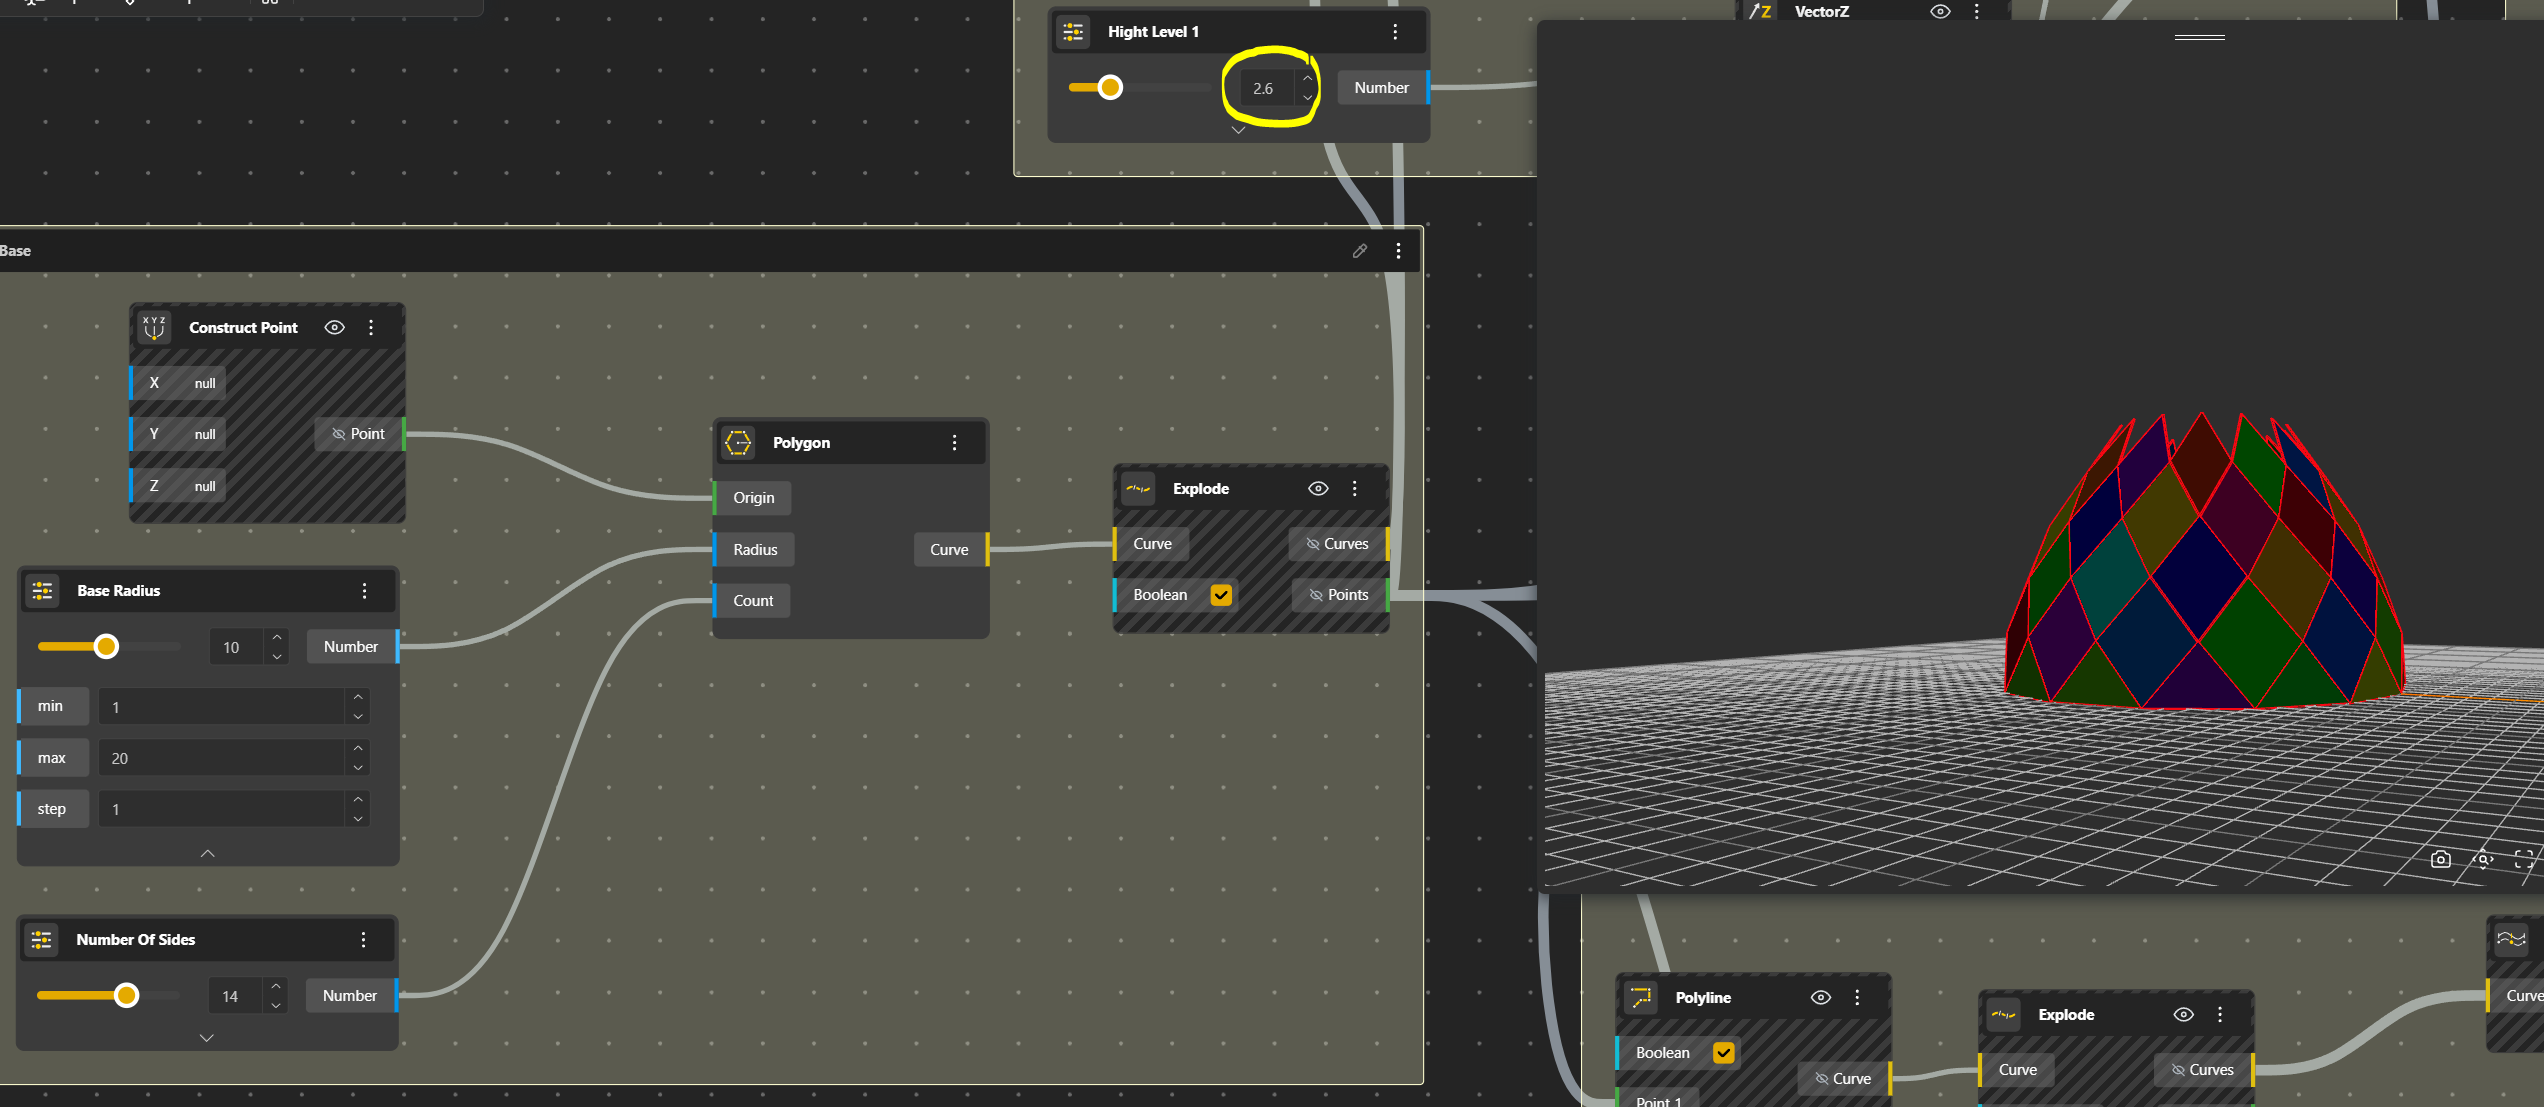
Ok now we have to build the first row of triangles. We identify for each segment the middle point that we move up a certain value. For that we use the Curve Middle Point that we connect to our Curves, we Move those Points in Z with VectorZ of which we give a value with a Range Input. We rename this Range Input into Height Level 1.
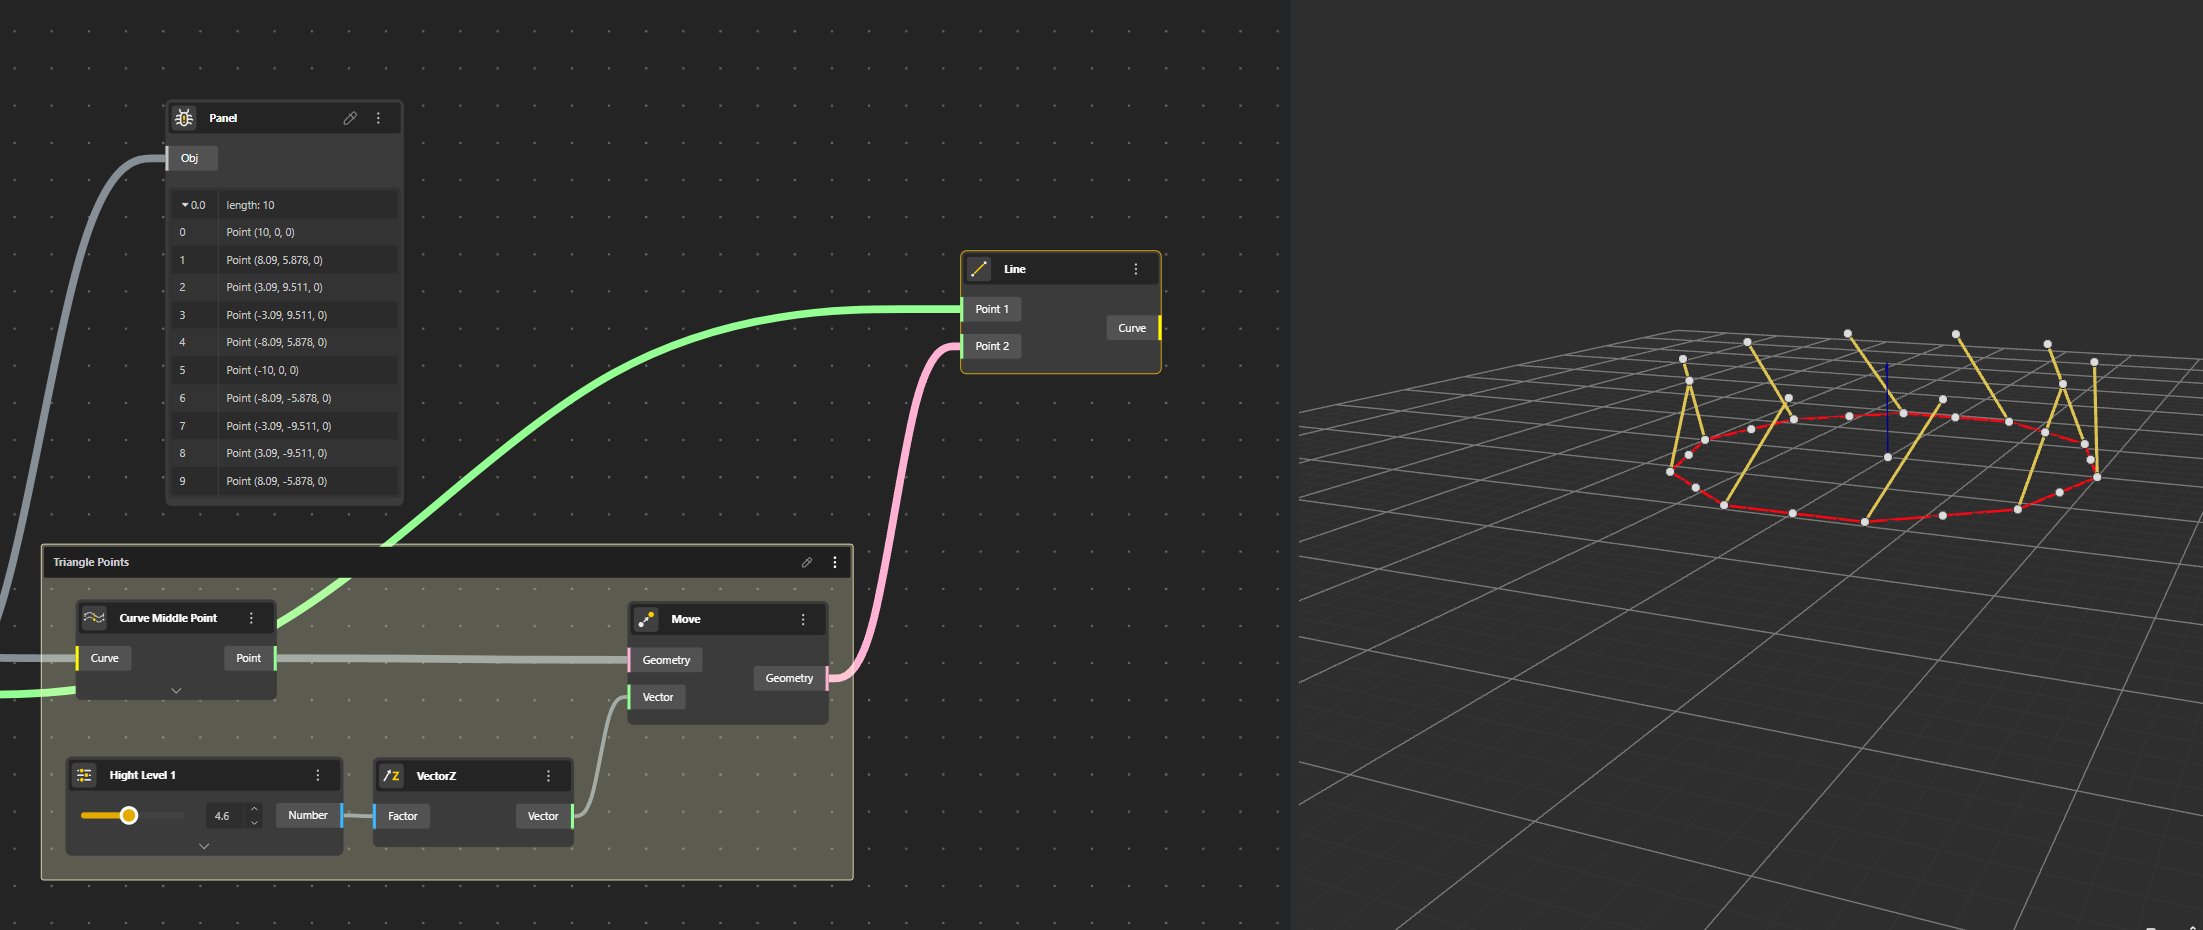
We now connect the points to create the triangles.
When the Curve is exploded we have a list of Points. Good, let’s use them.
We connect it to the raised middle Point for the first side of the triangle.
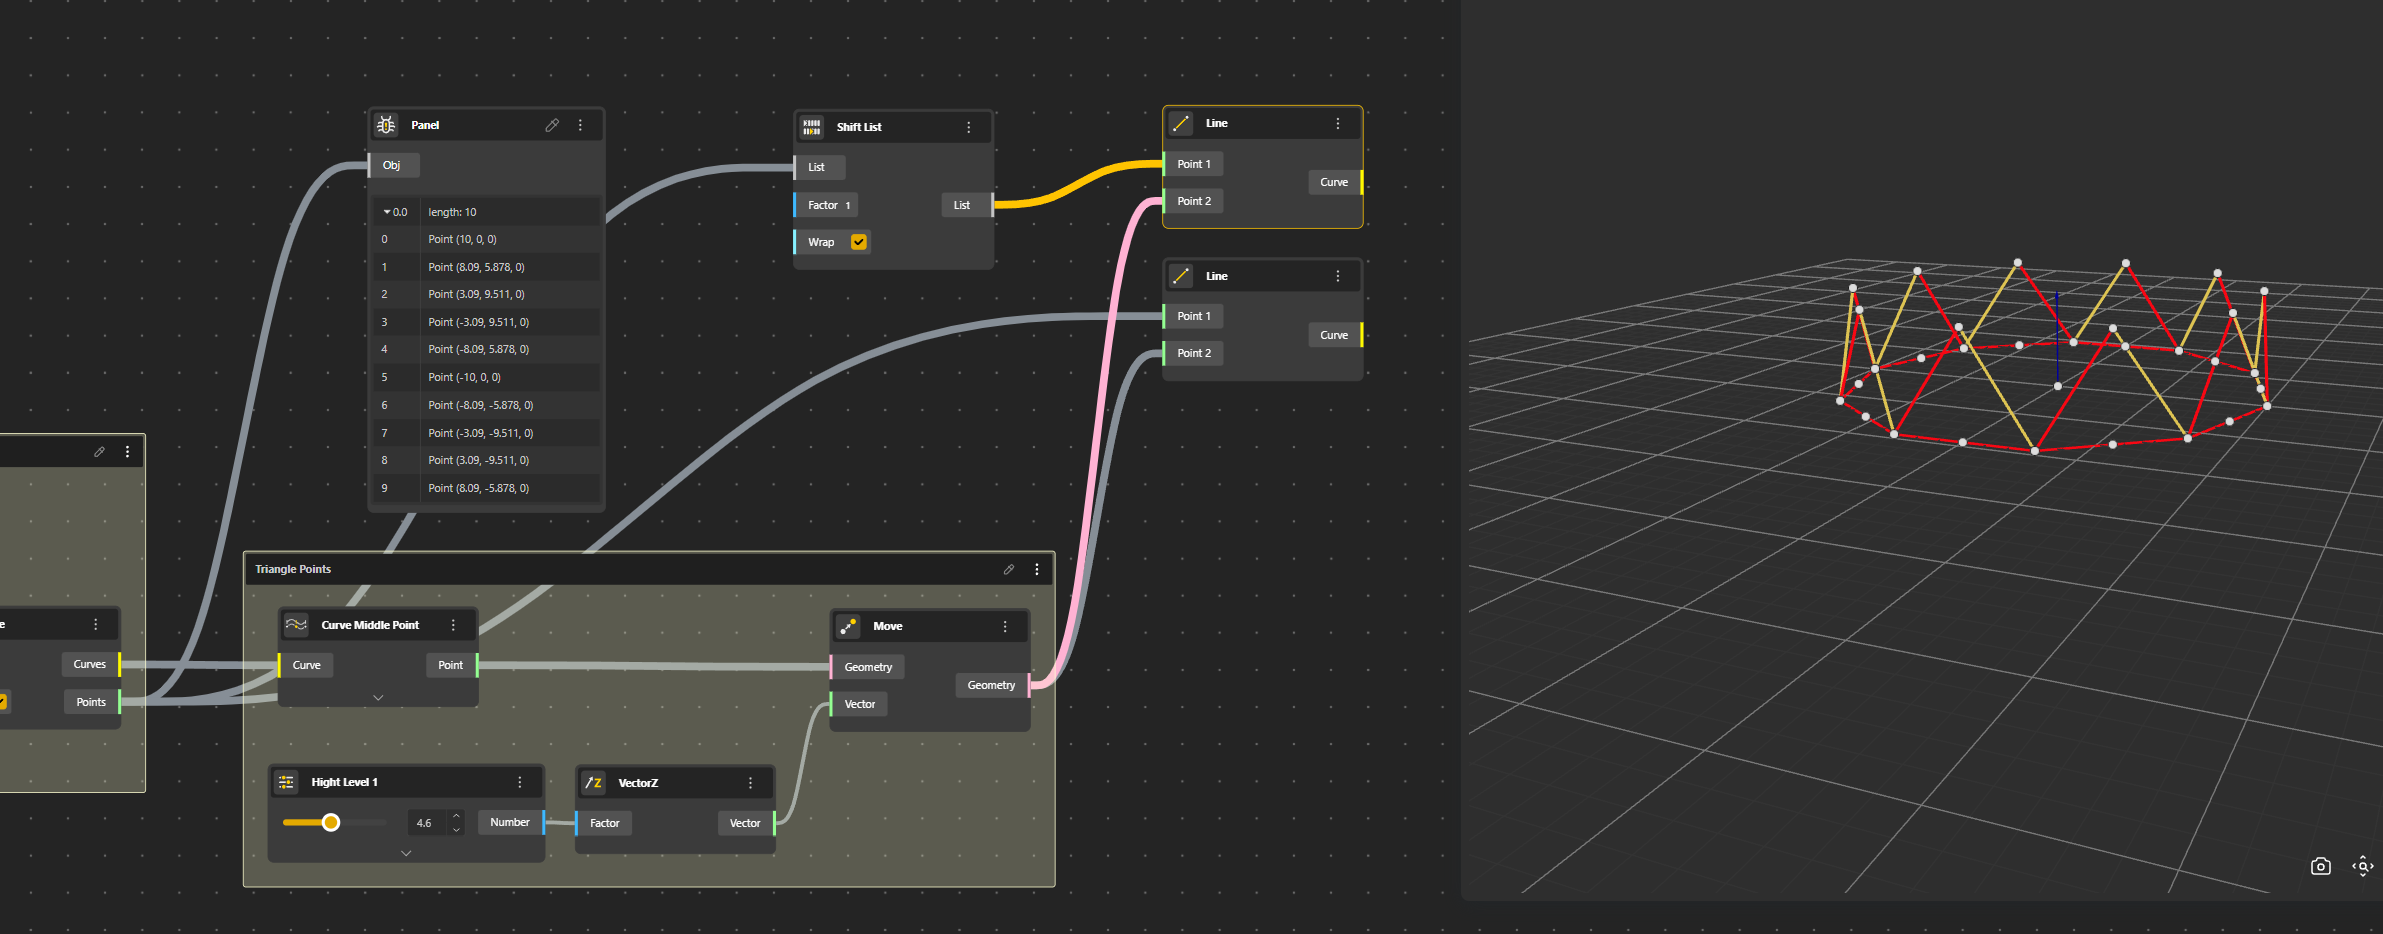
Then we will Shift the list so that Point N°0 will be Point N°1. This way we can have the third side of the triangle.
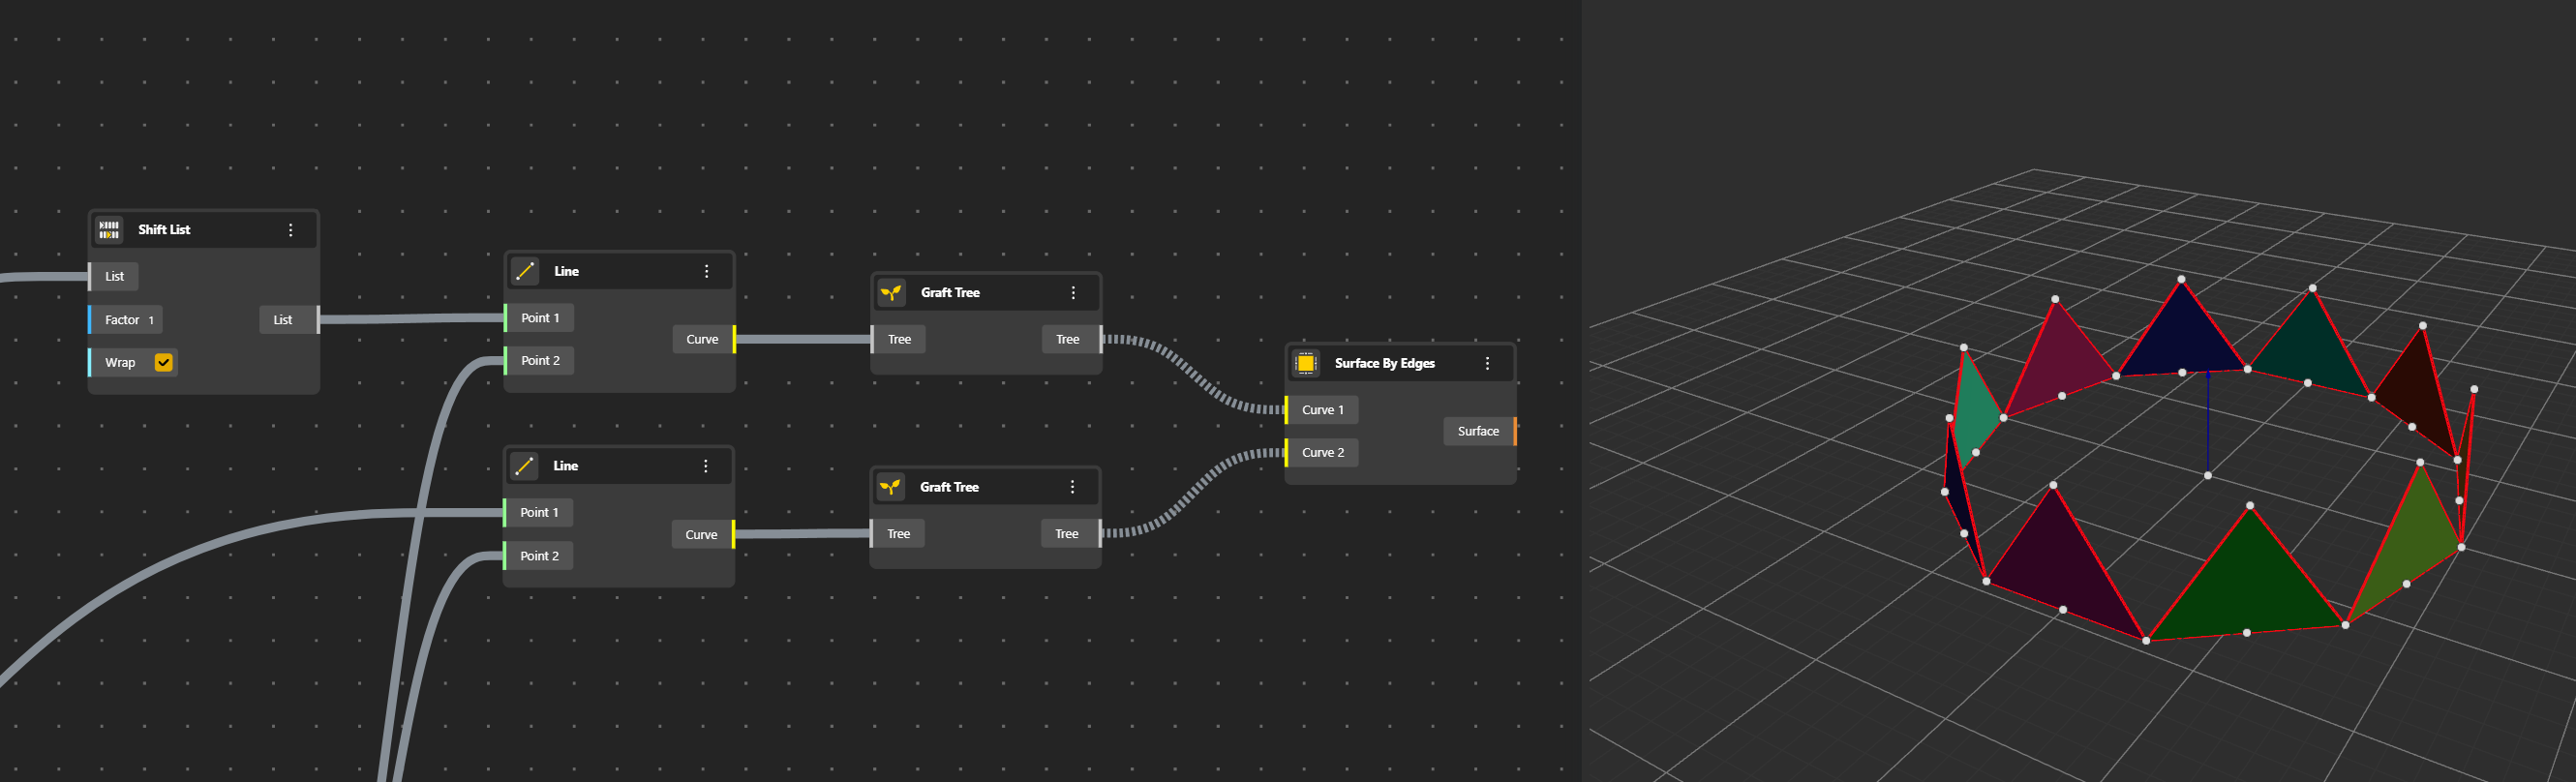
We can get the Surfaces by using Surface by Edges. But first, each triangle shall be placed in a separate list with Graft Tree.
The « Flatten Tree » and « Graft Tree » components are used to manipulate the structure of data trees, which are a way of organizing and storing data in a hierarchical structure.
Flatten Tree: This component takes a data tree as input and removes all the branches, placing all the elements in a single list. It effectively converts a data tree into a flat list of elements. This can be useful when you want to perform operations on all elements without considering their hierarchy.
Graft Tree: On the other hand, the « Graft Tree » component adds a new level of hierarchy to the data tree. It takes a list of data trees as input and places each data tree onto a new branch. This can be helpful when you want to combine multiple data trees into a single, more complex data structure.
Both components play an important role in managing data structures within Grasshopper, allowing you to adapt and manipulate your data to suit the needs of your algorithmic design process.
These are the very principles of algorithmic design. Hard? Yes, we will be back on it.
So we take A Graft component which means that we associate one line in a line and the correspondent one in the other one to create the Surfaces.
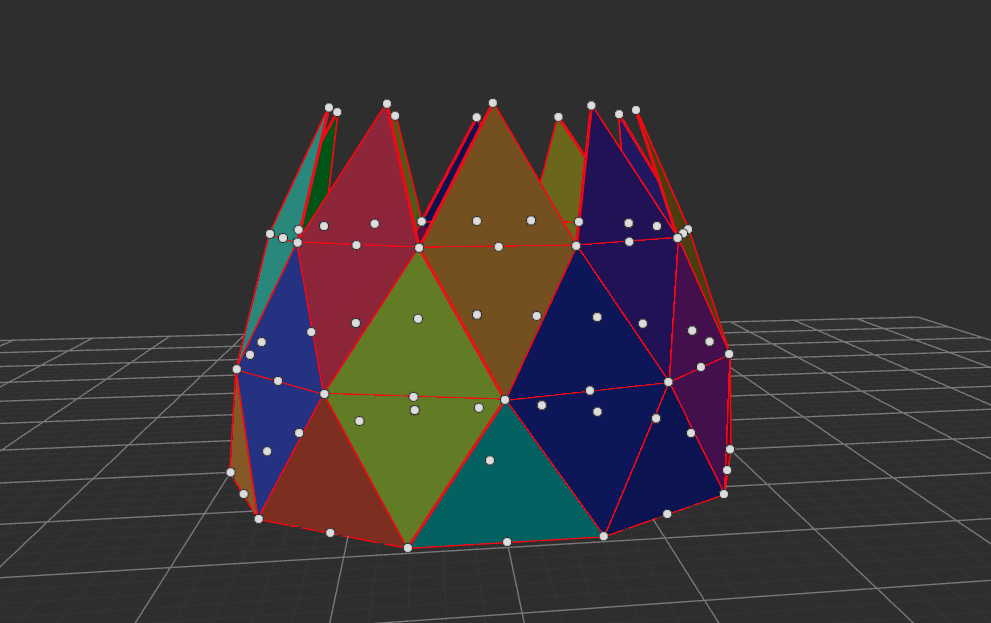
Second row, flat quadrangular glass panes
The magic of the structure is that, everything is derived from the first row. Simple geometric transformations shape the dome. Let’s check it out.
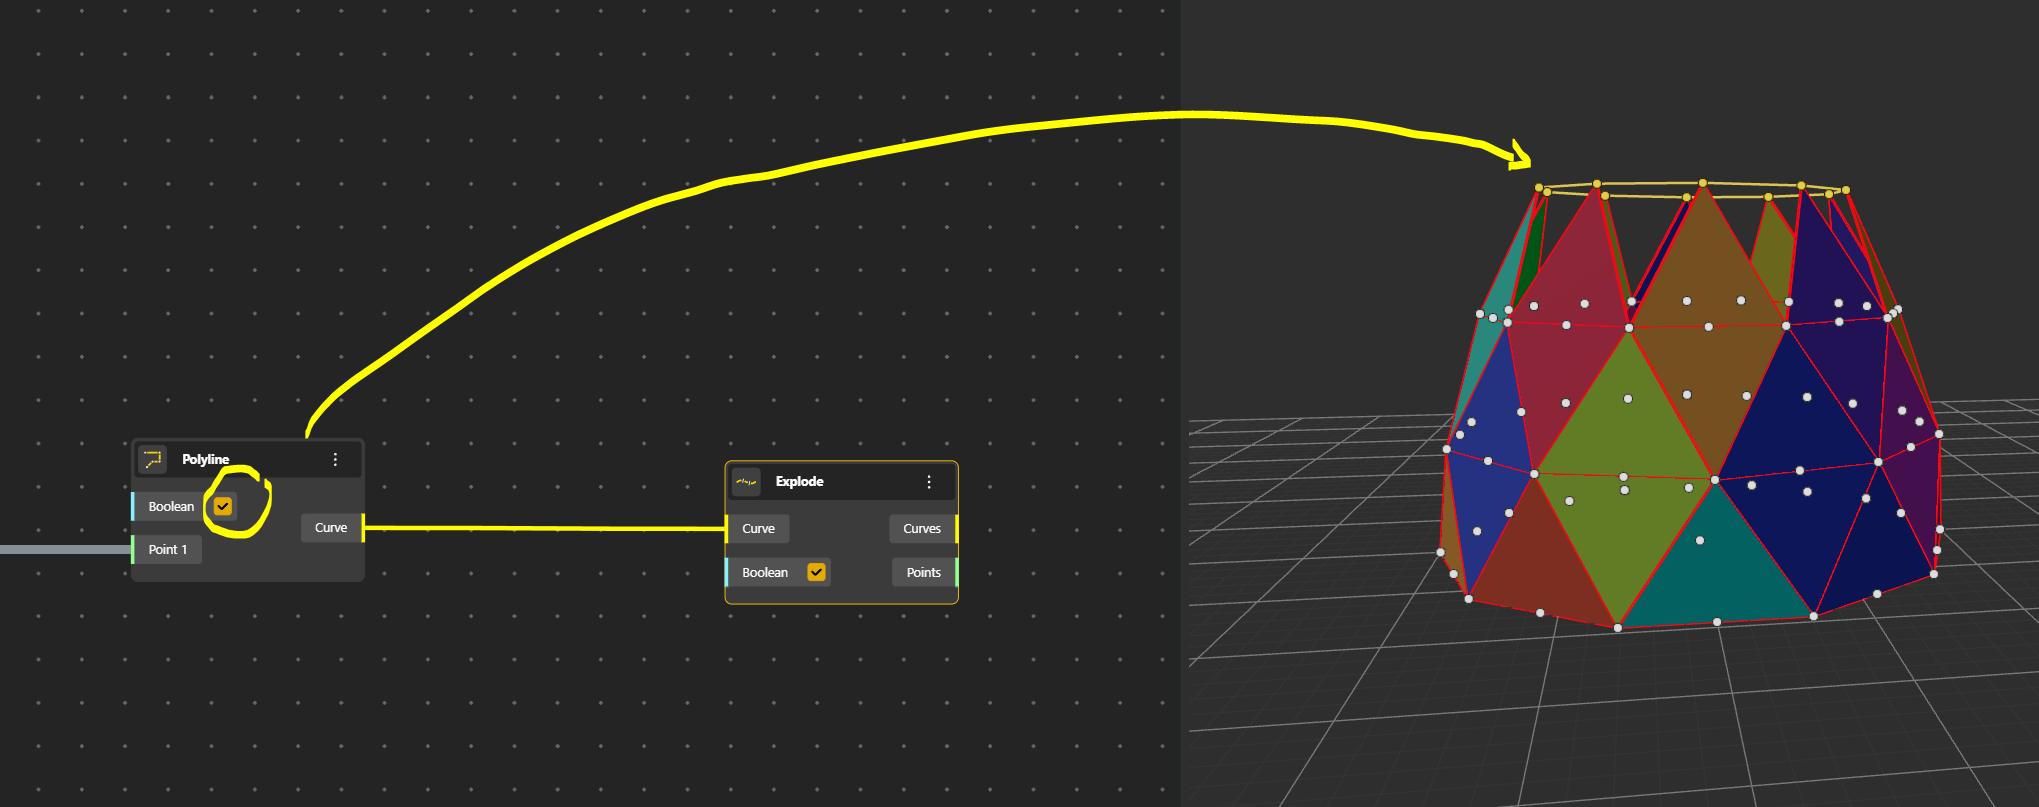
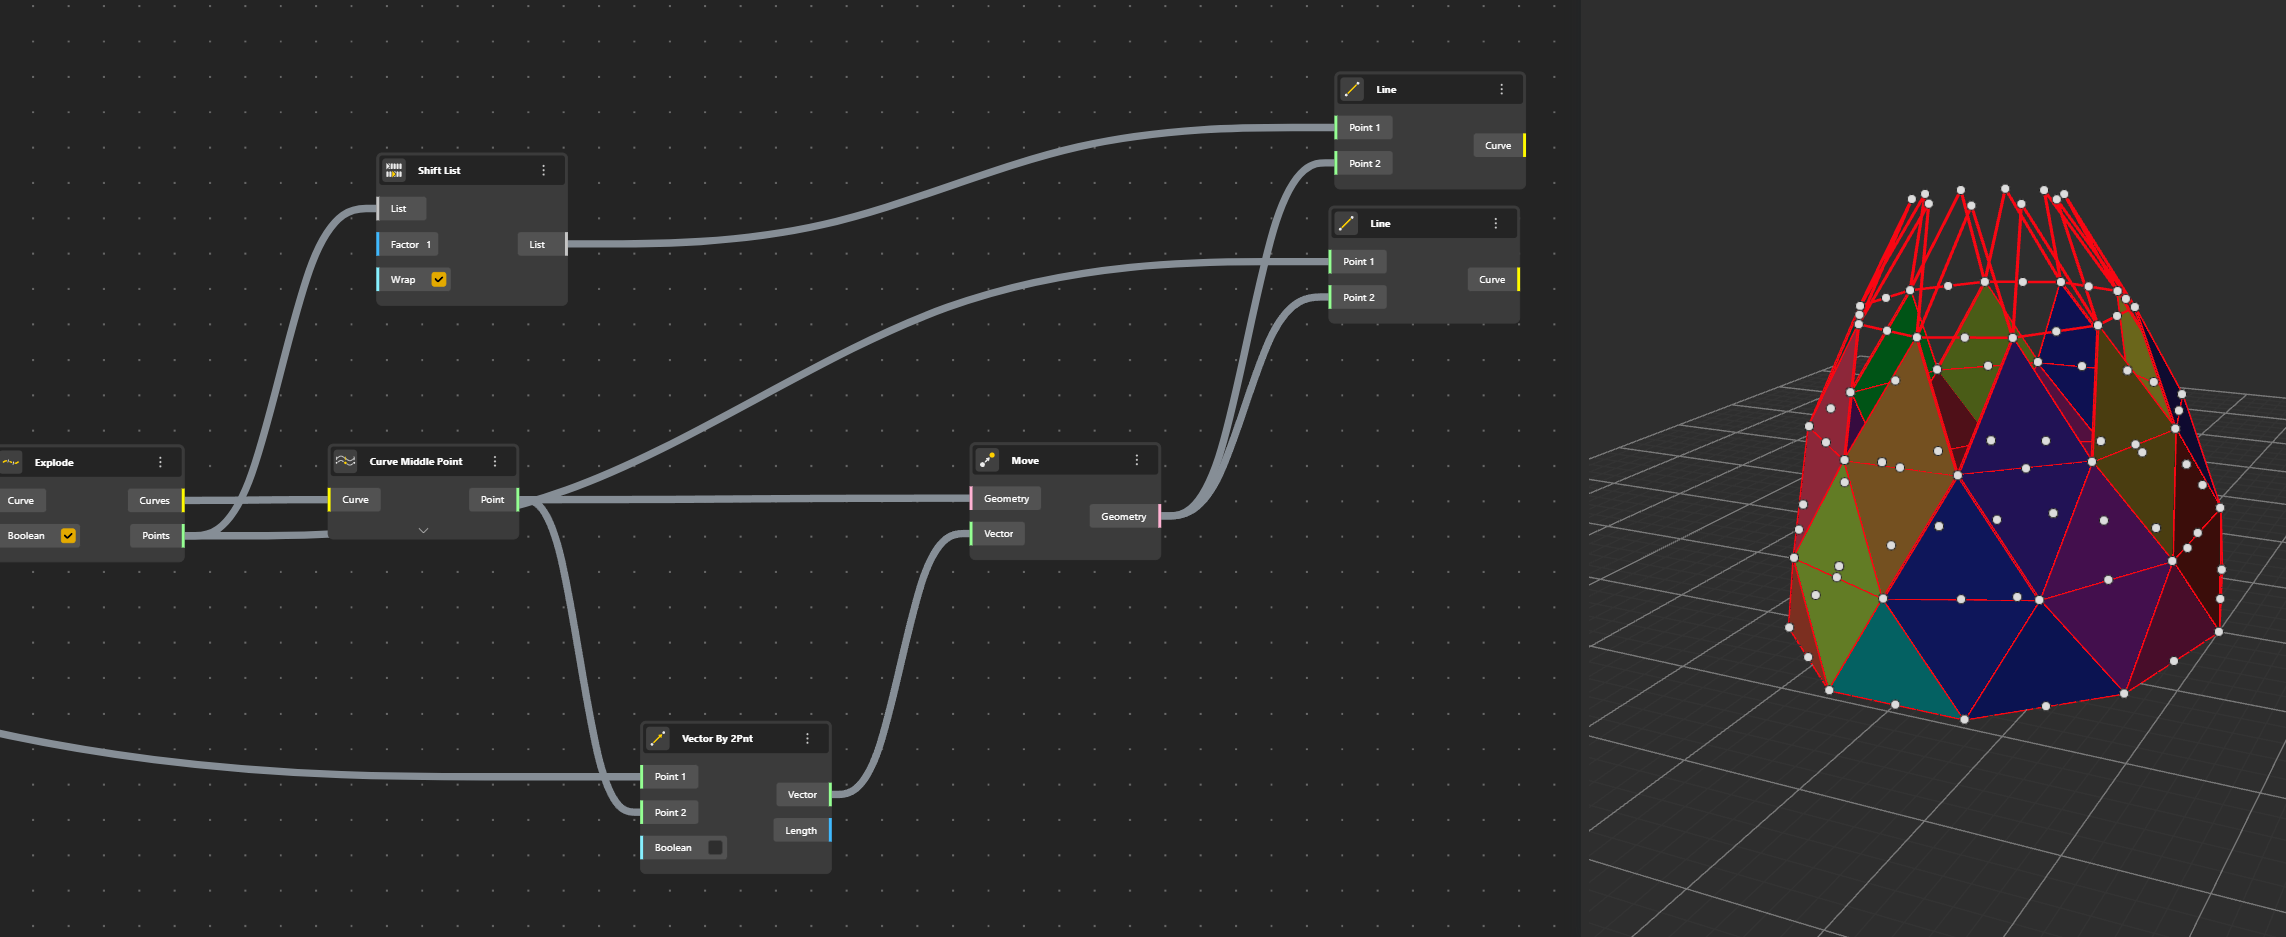
The idea will be to create the flat pane by adding the points of the third row.
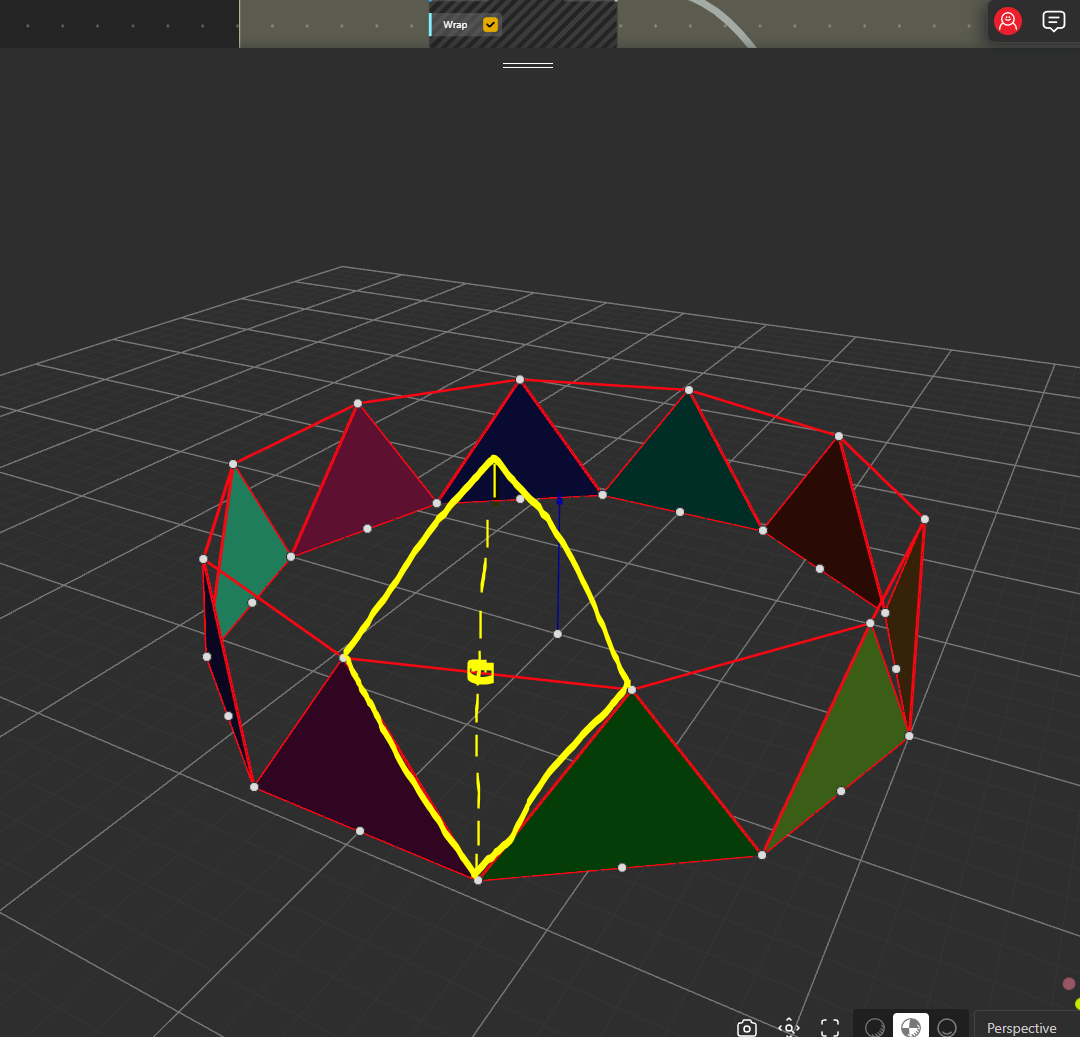
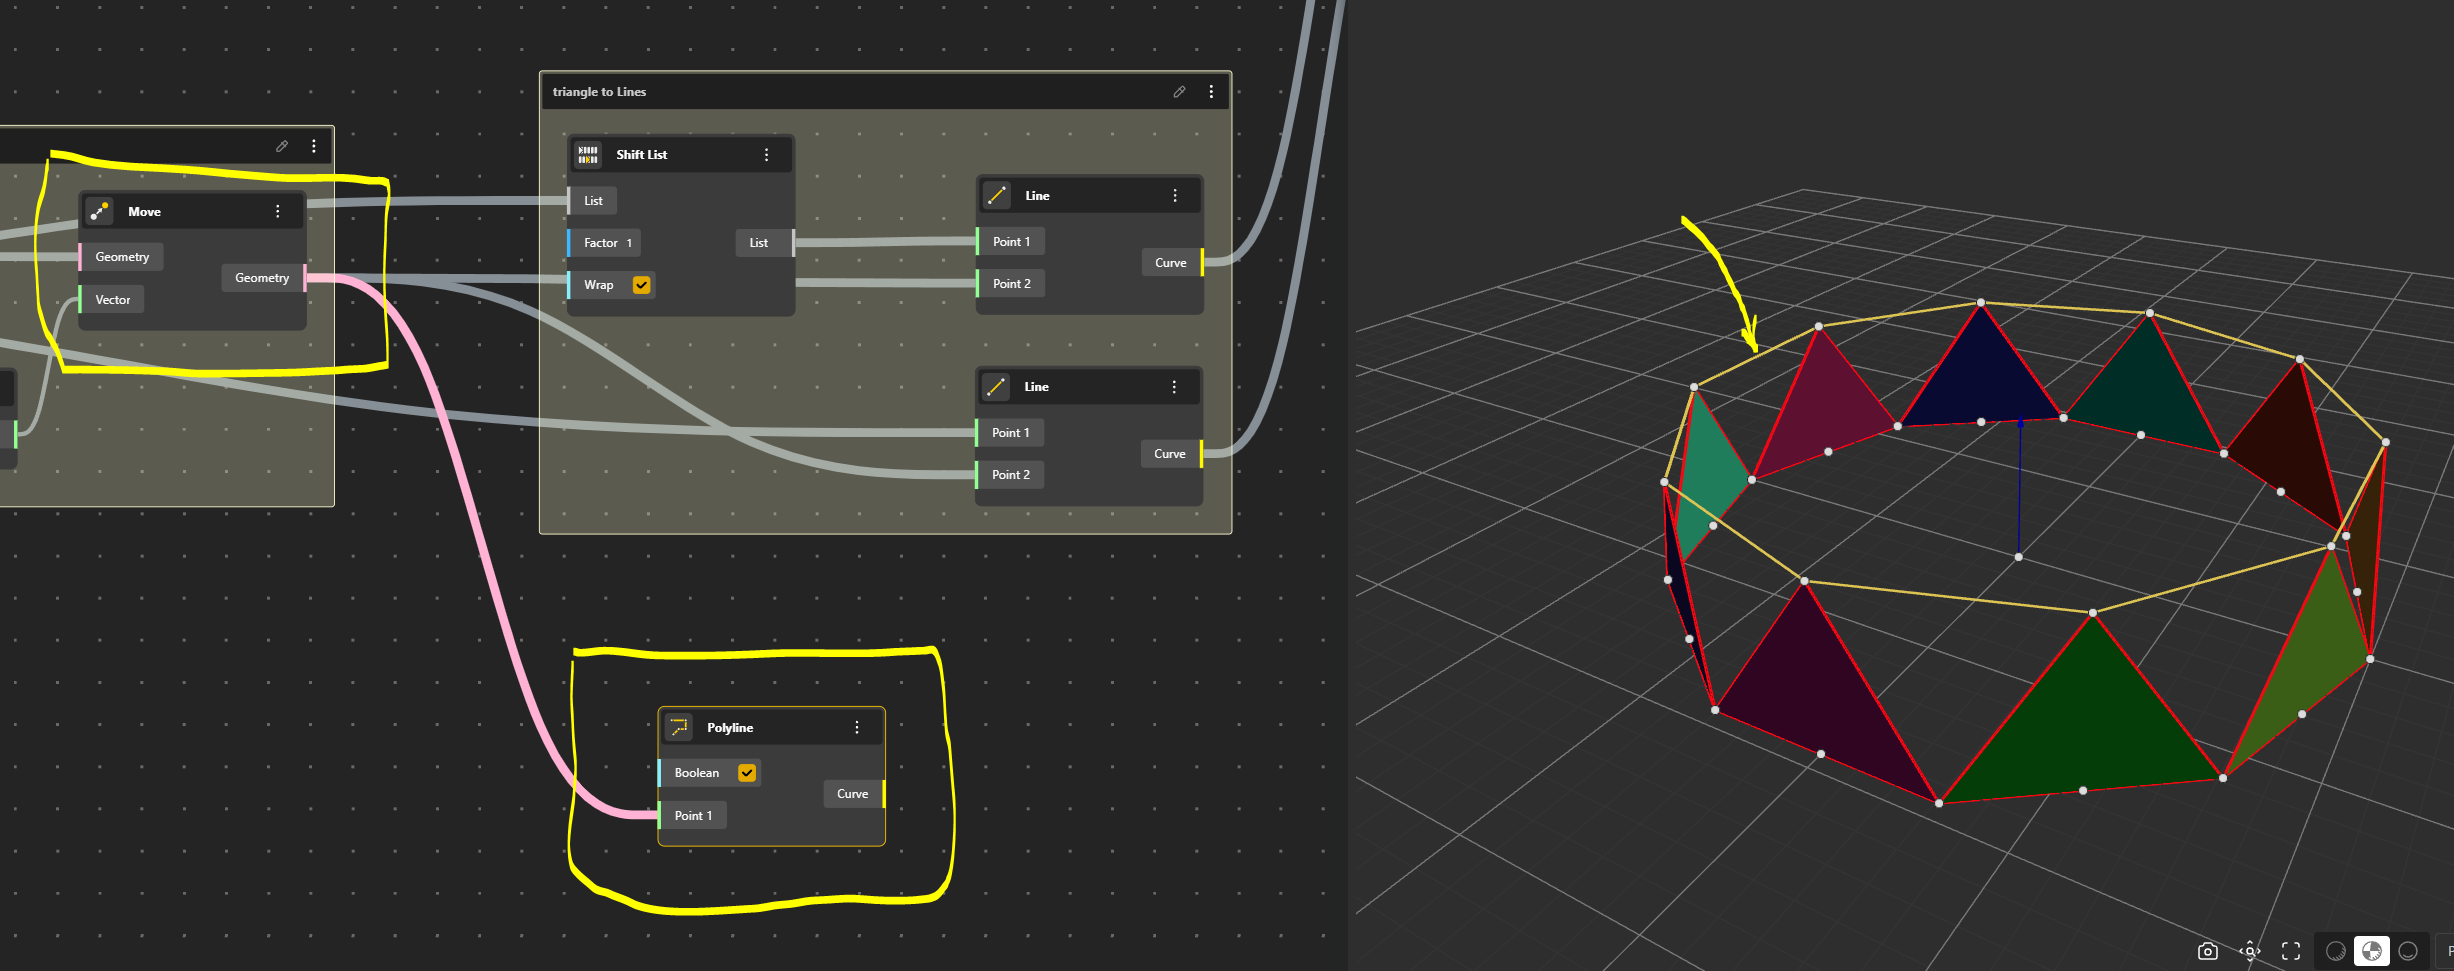
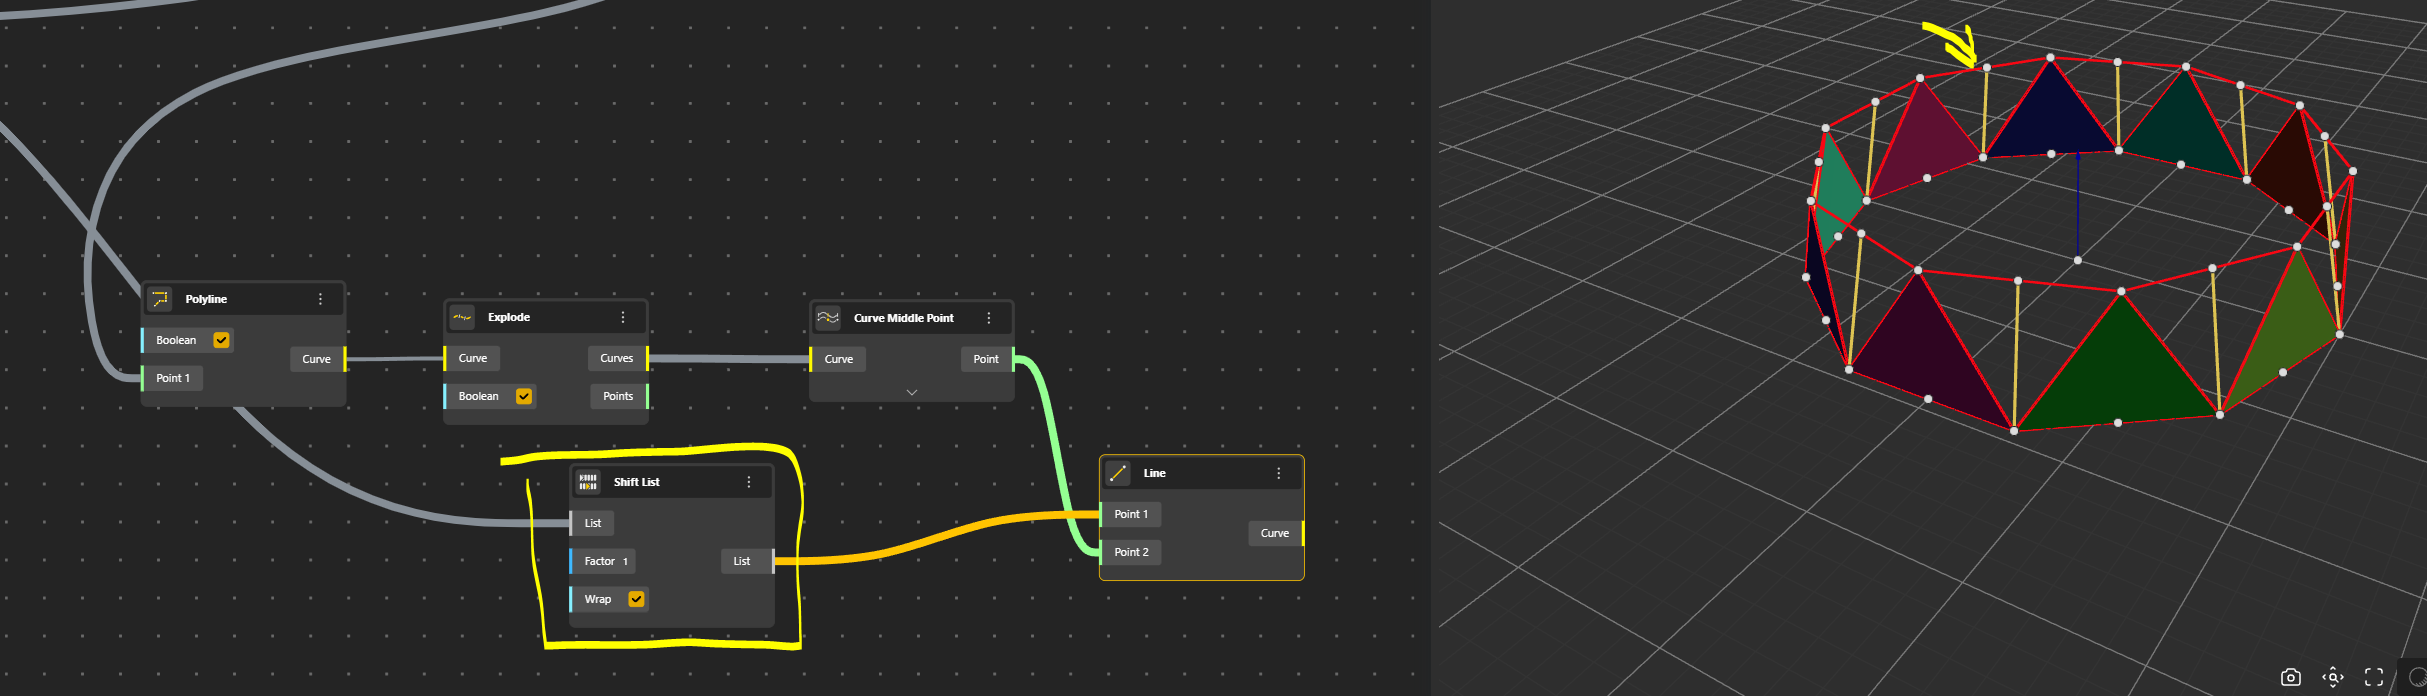
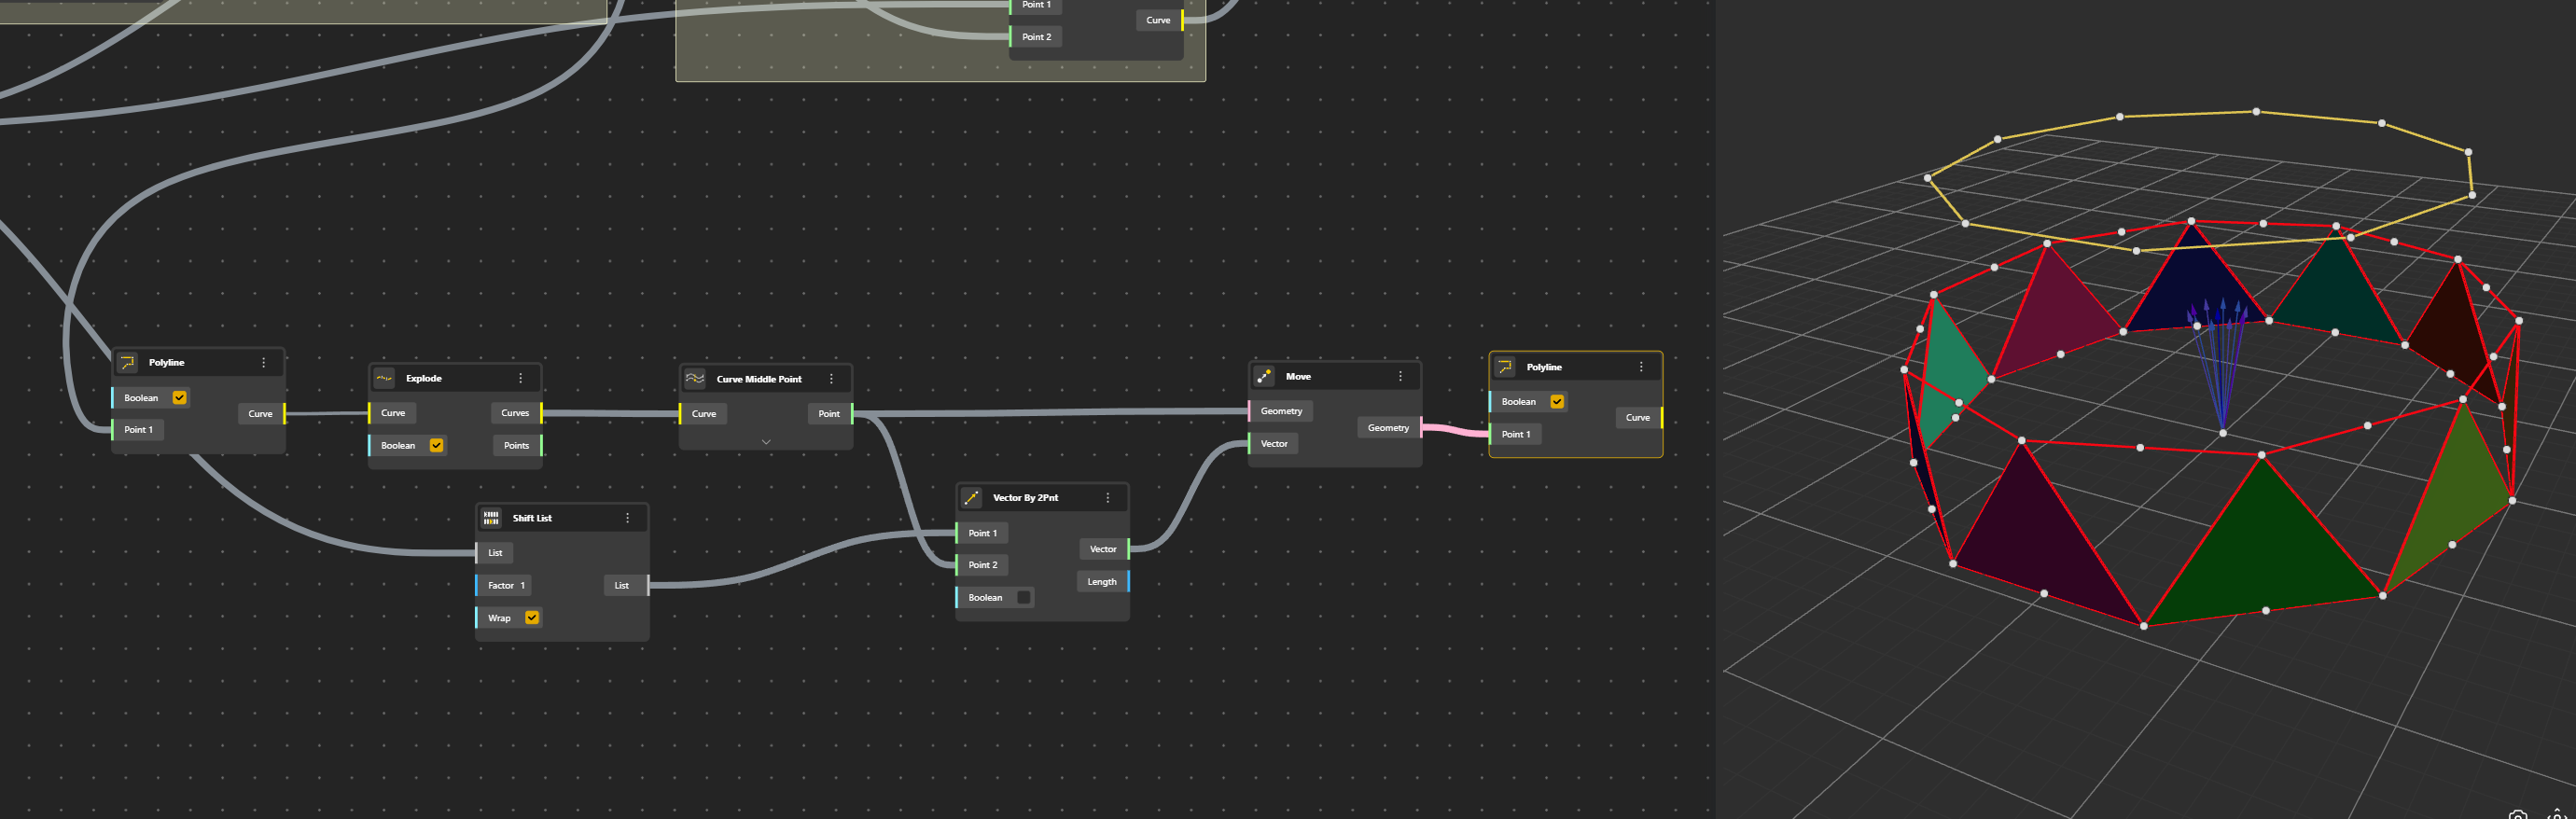
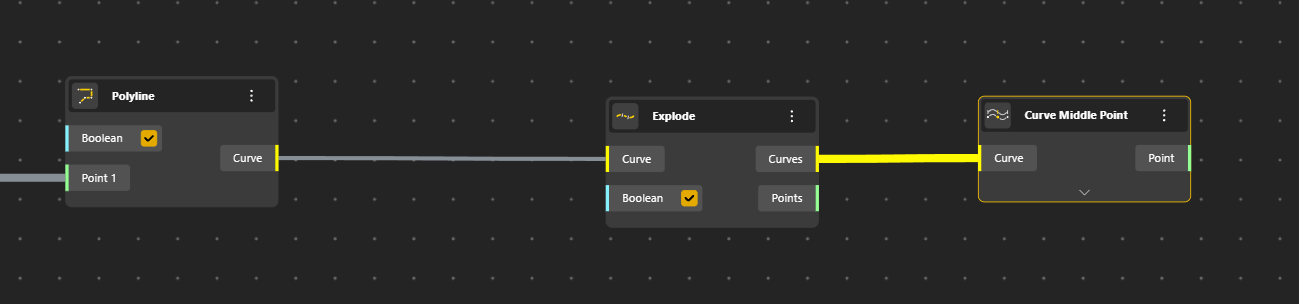
The Polyline is exploded and then we find the Middle Points.
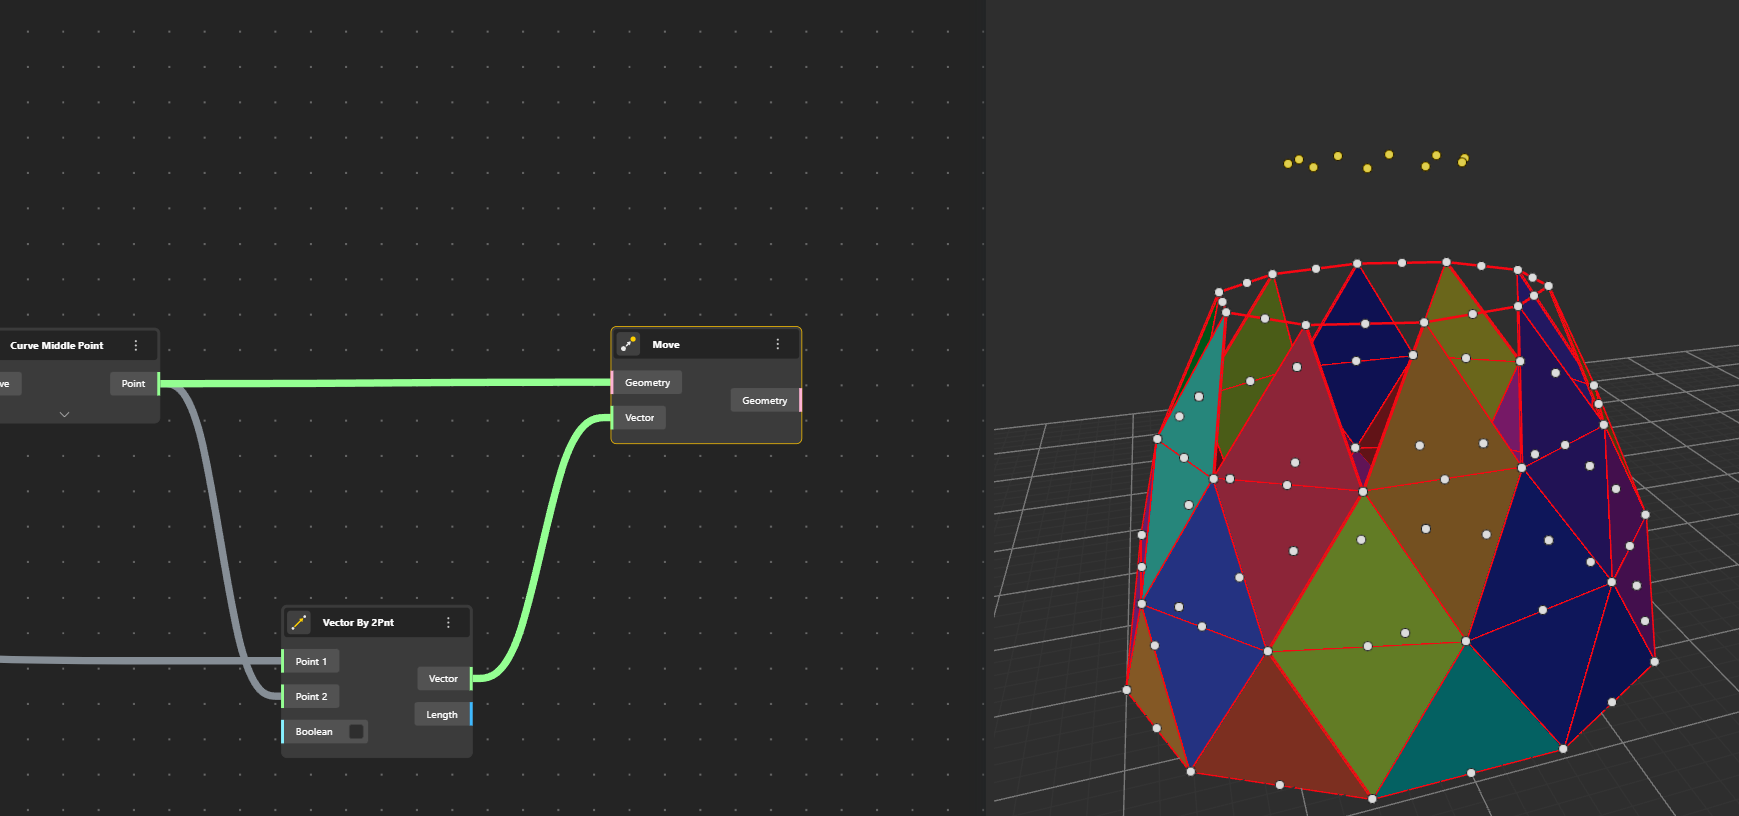
We need to create the diagonal line of our pane. For that we just move Points along a Vector 2 Points. Let’s see that.
To identify the vector we can create a Line 2 Points, just to visualise this vector. We connect the points from the base row, to the middle points of the second row…oops…problem.
We need to a Shift List component. Ok it works.
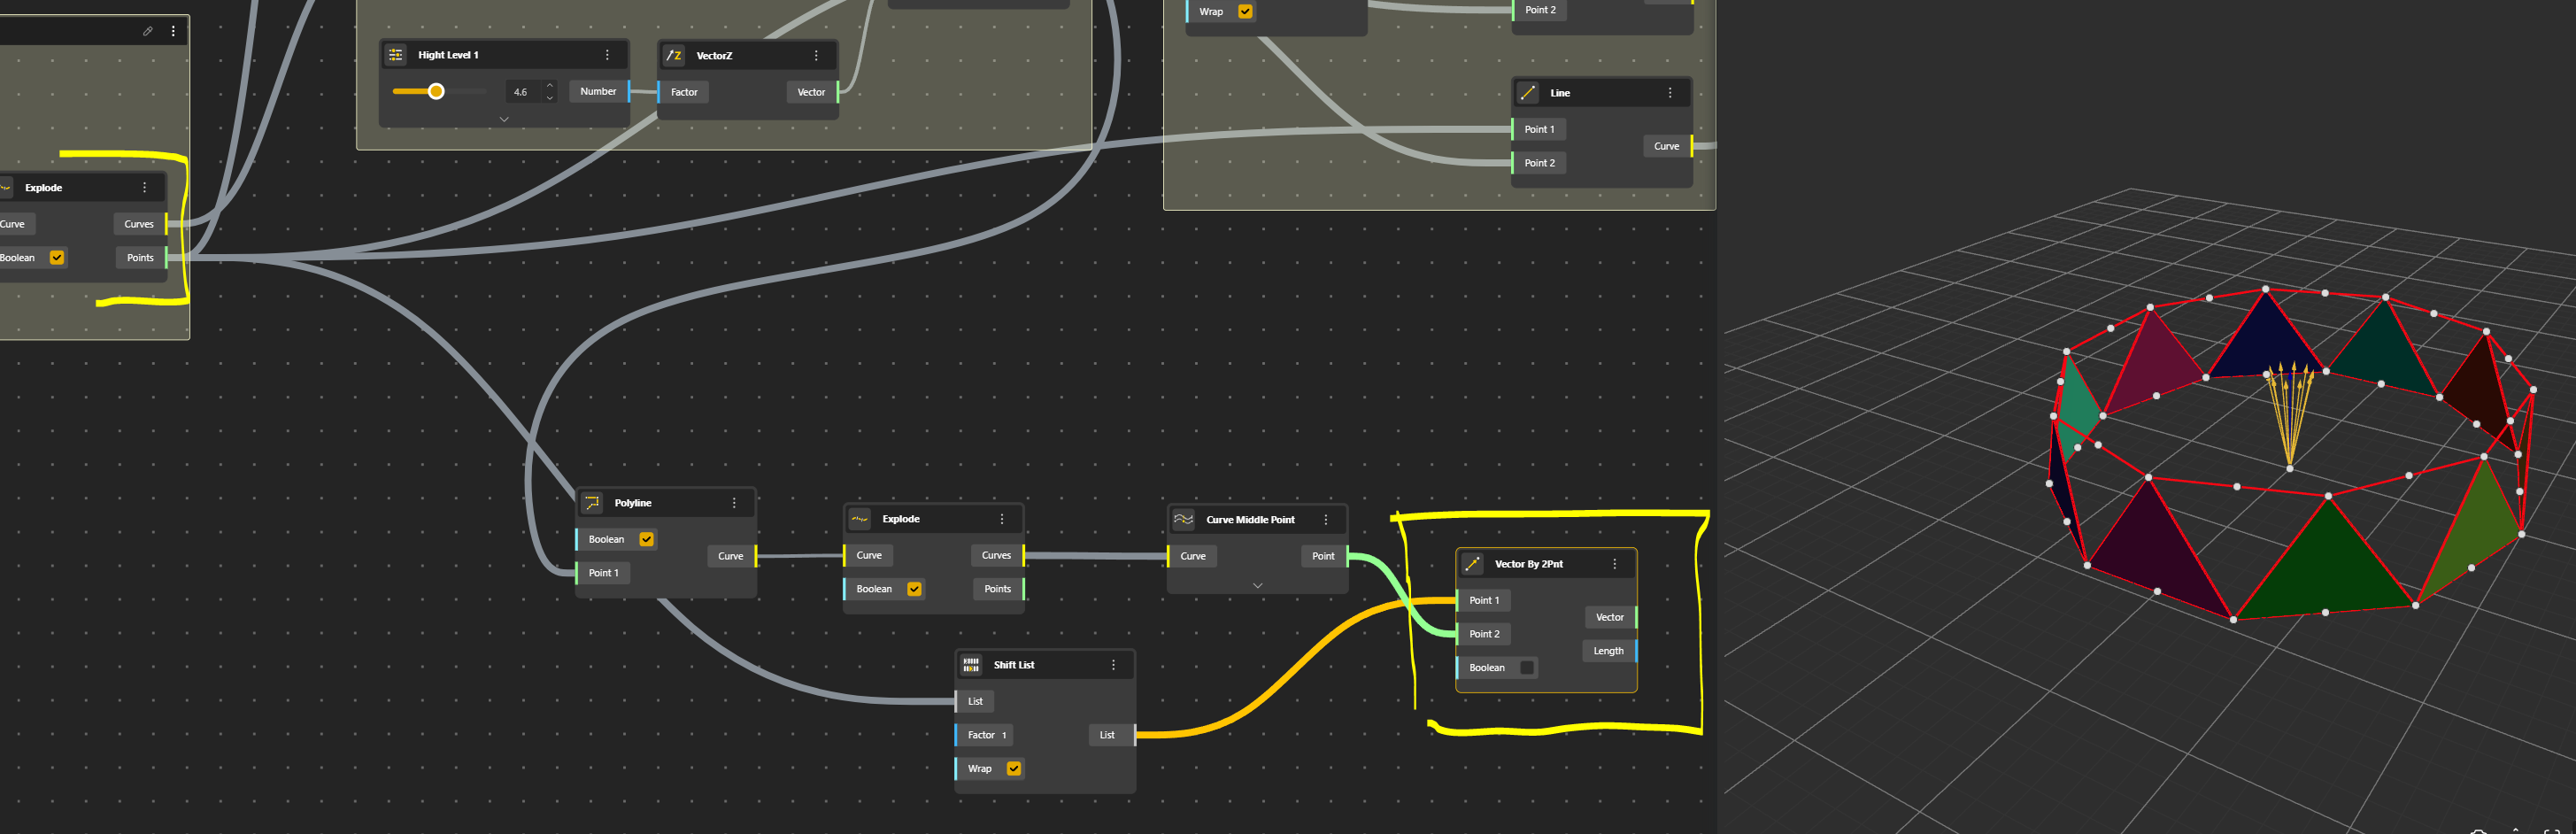
Now we can replace this Line 2 Points by Vector 2 Points.
Now we can move our points to create the third row.
Ok, a Polyline has been created to visualise the result and anticipate the next phase.
Let’s add the edges
It’s quite easy at this stage it follows what has been explained just above, connecting the points.
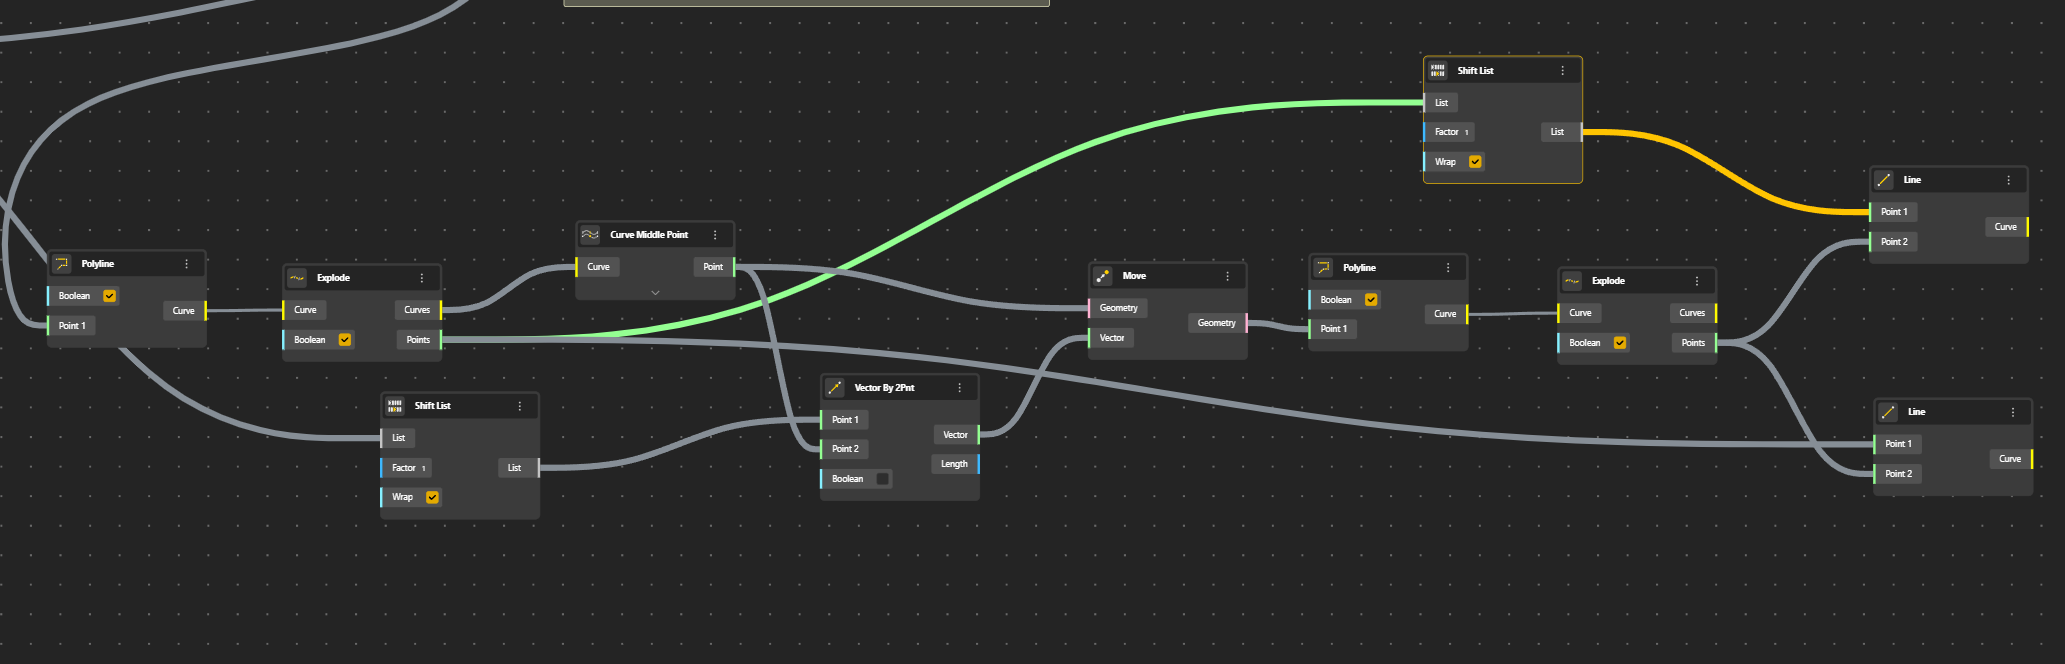
We can create the pans by this time using 4 Points.
Just beware to have them in the right order. Whatever it is, it does not mind.
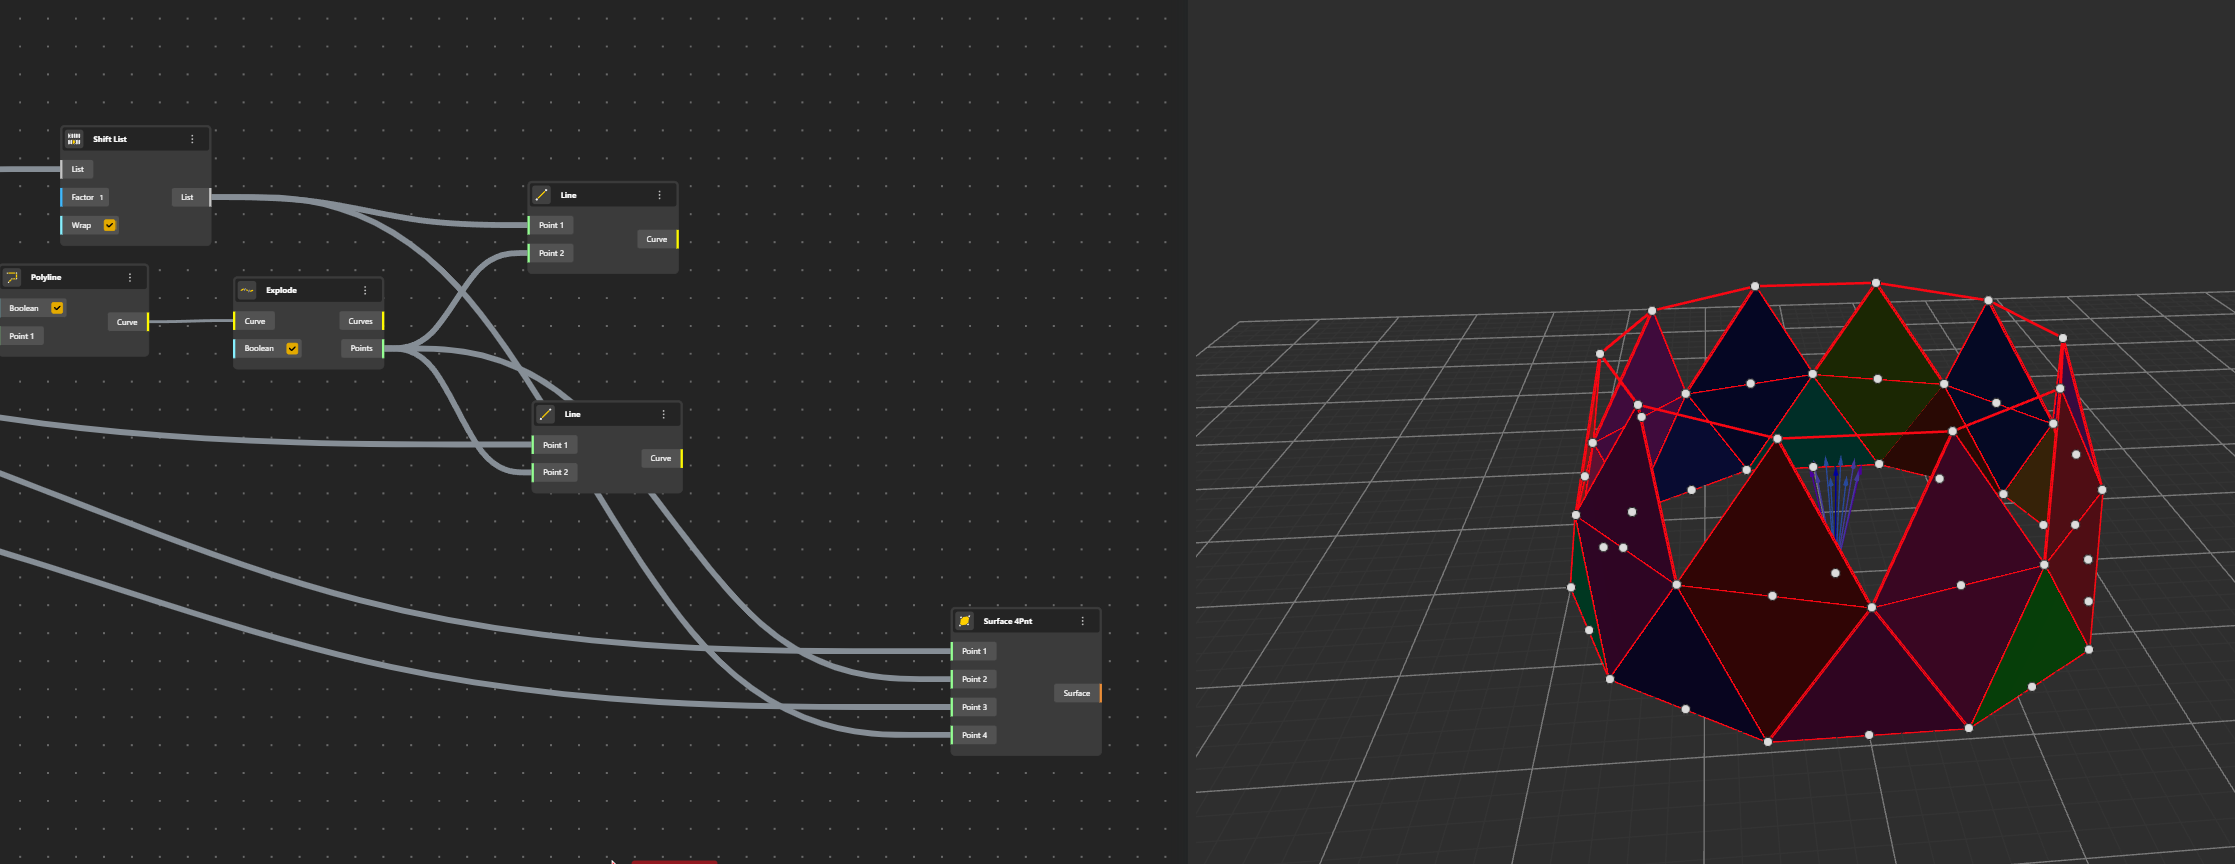
Ok each time I tried I had a different combination. What is important is to have the panes done.
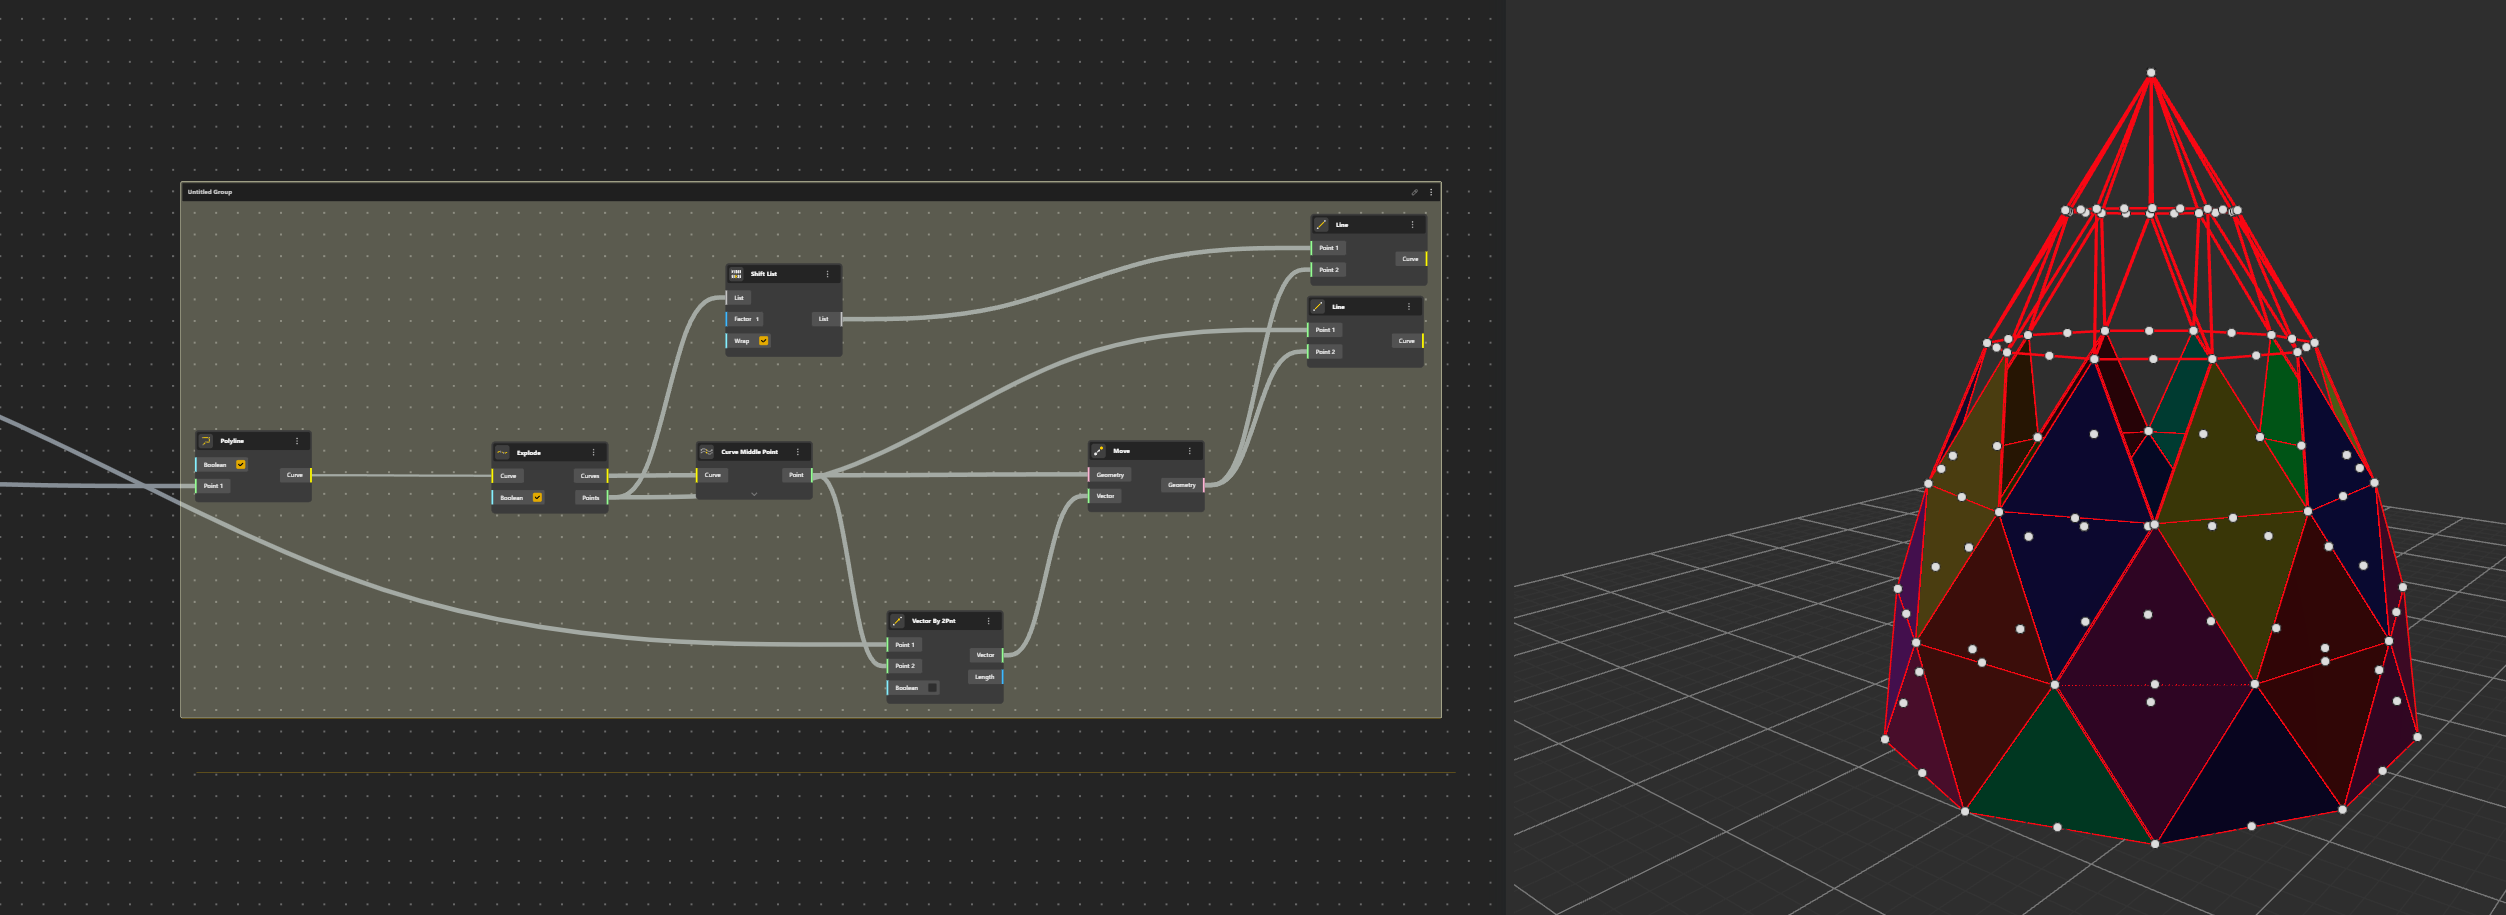
Repeating the process.
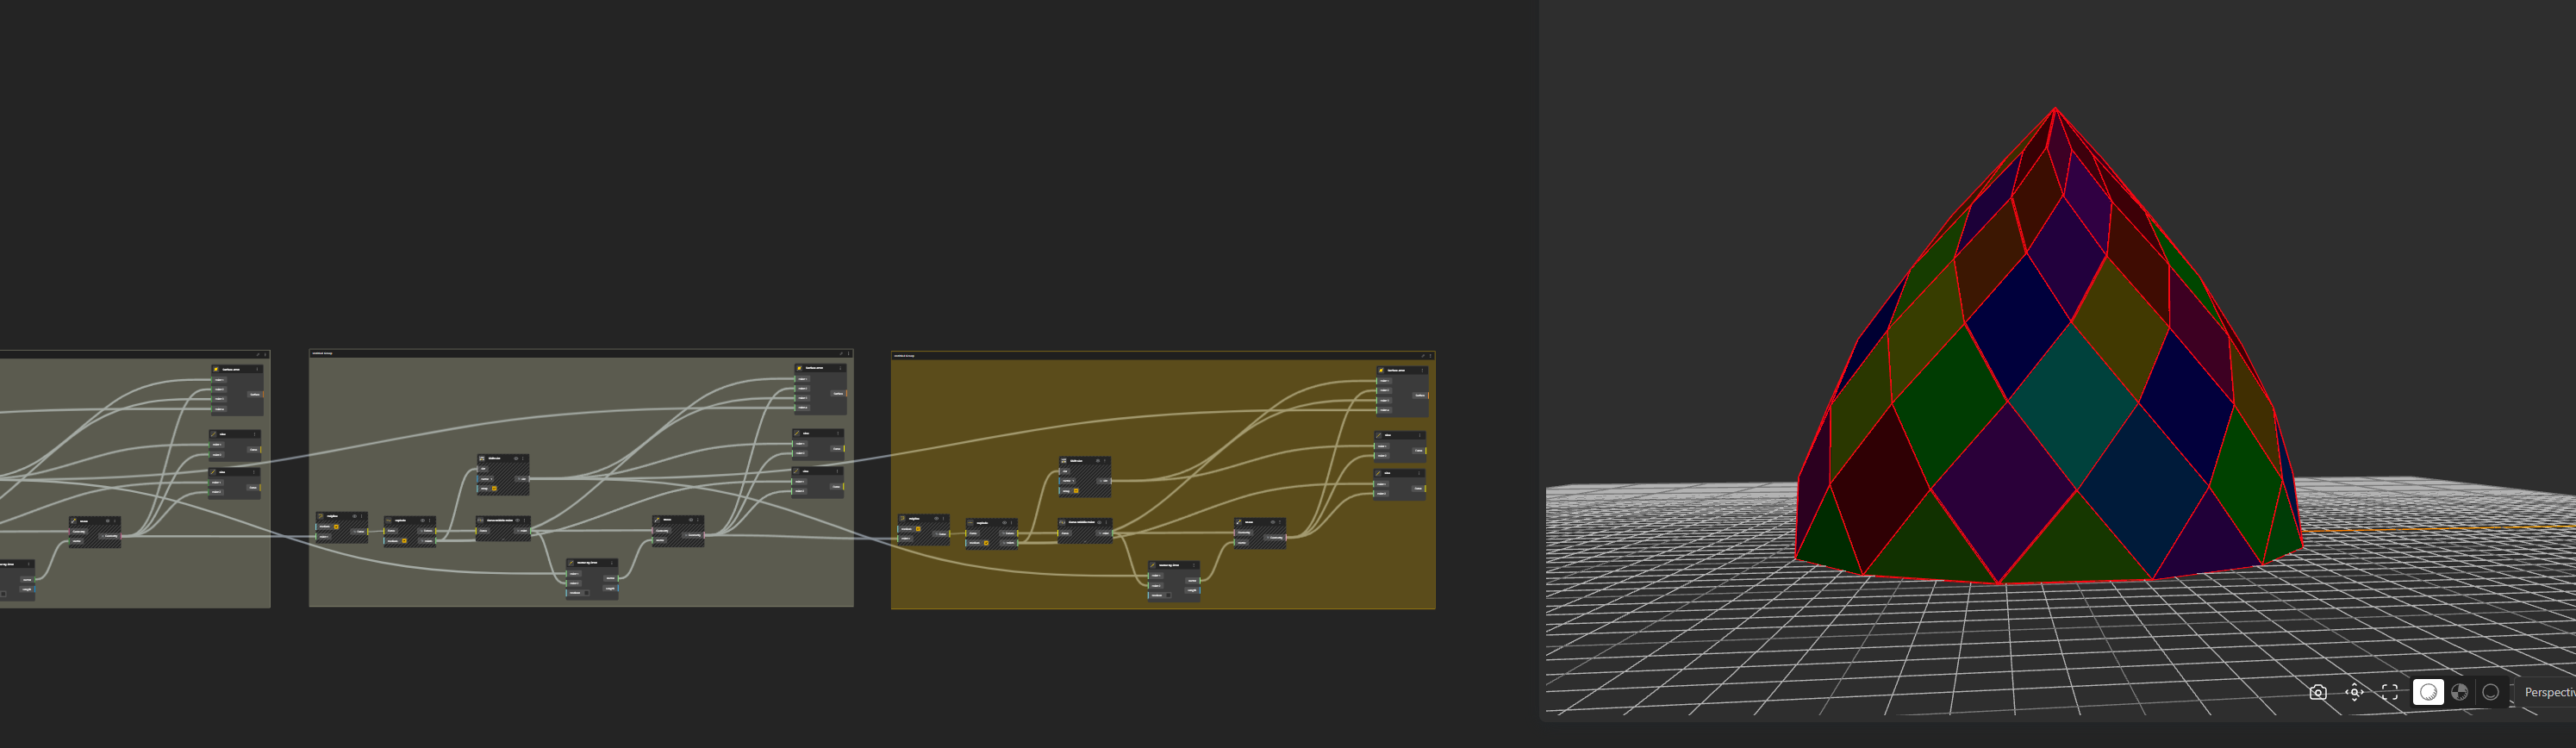
OK now it’s just a matter of repeating what has been done before for the following rows…
Ok, it’s getting a bit messy now, but it’s the same pattern. Not difficult, just a problem of not being confused.
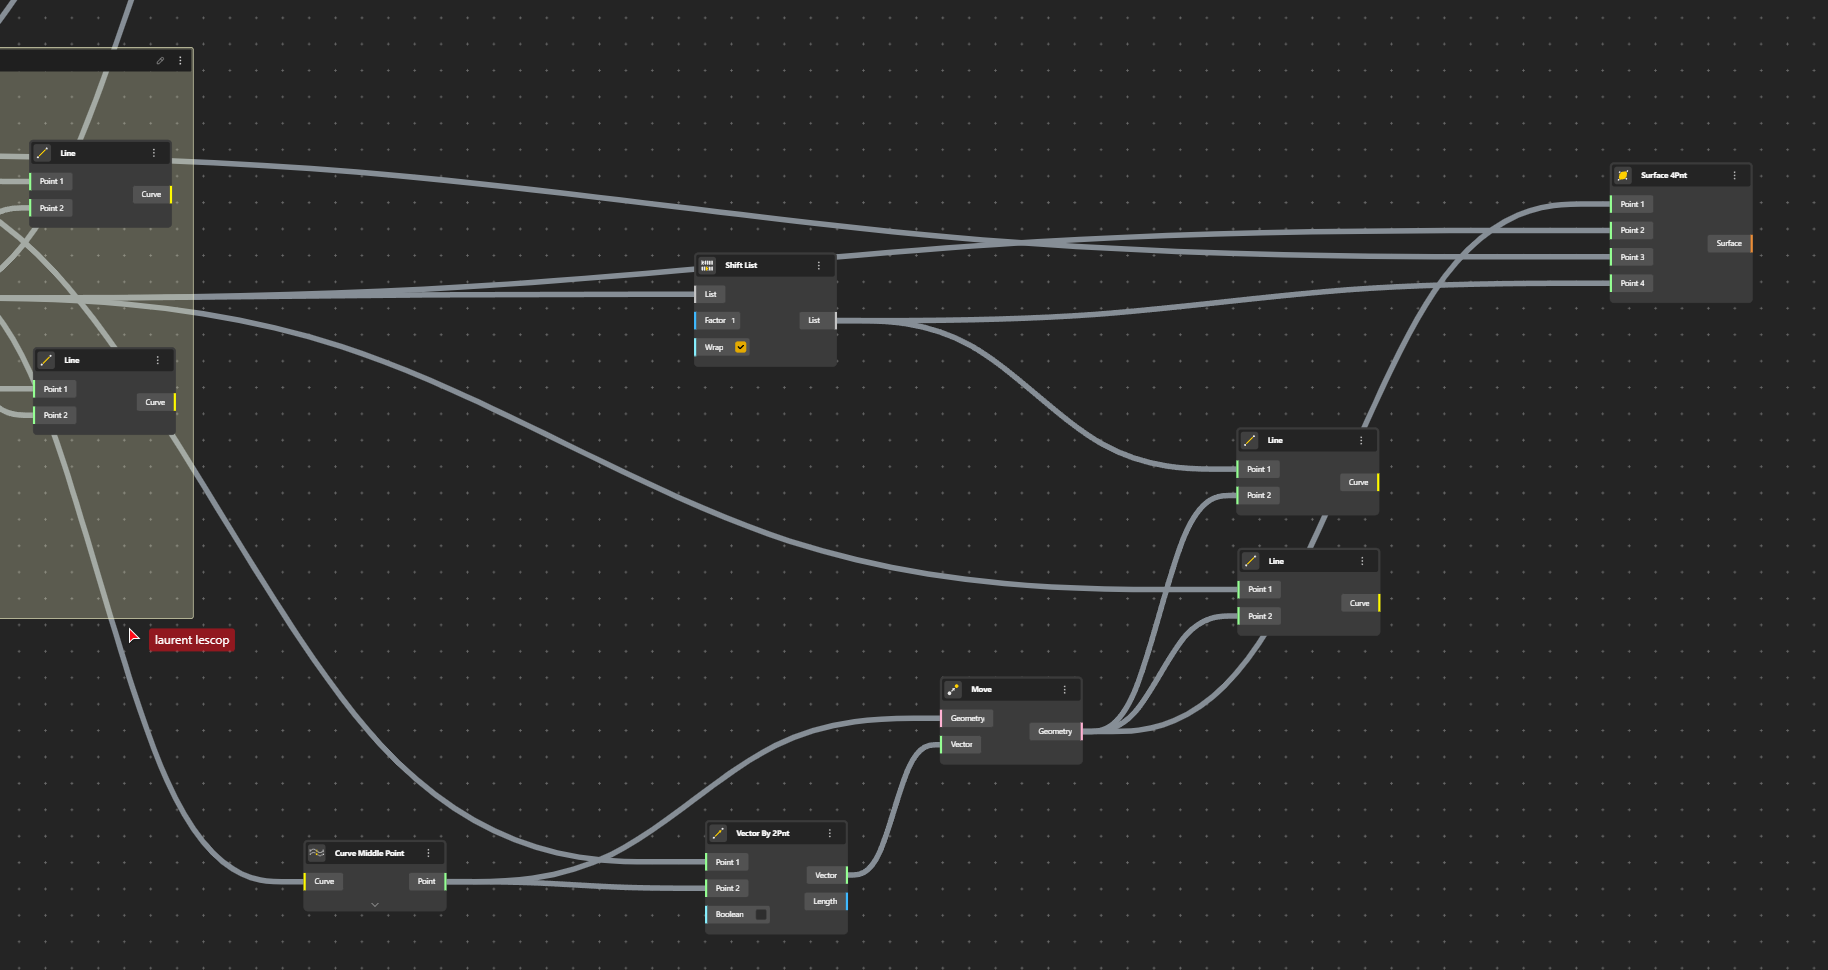
Let’s continue further and further
Polyline, explode….Curve Middle Point
Then vectors (Vector 2 Points), Move
Lines….
And if we add another level, we’ve got it all
Surfaces
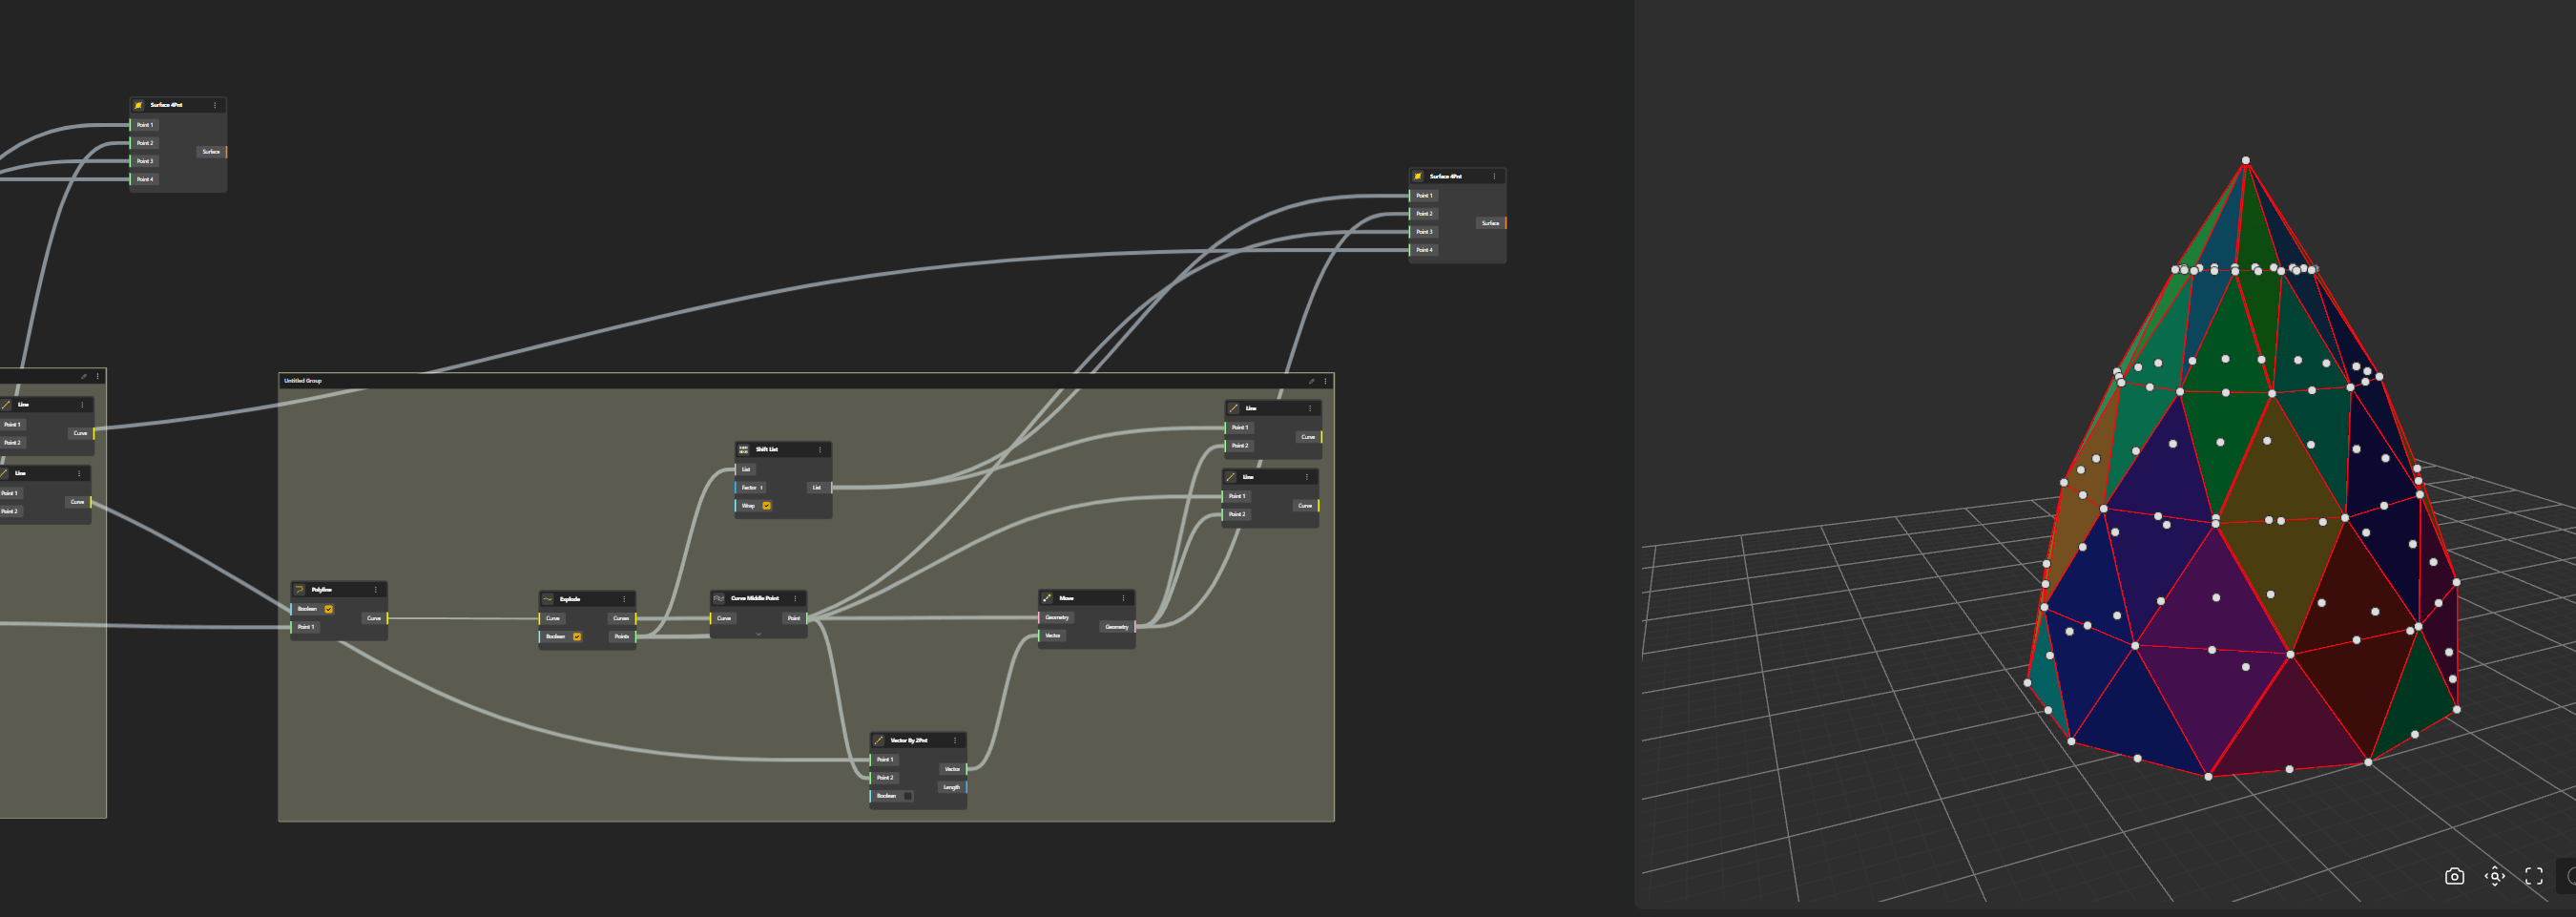
In the end we see that this Pattern is the most important and can be repeated for each level.
Getting the shape.
This definition gives the most direct result, but we see on the real Bruno Taut project that, the shape is slightly different. It is because, all level don’t derive directly from the previous one. Let’s break it down.
First we clean up a bit and hide what we don’t want to see…
First, let’s play with the shape.
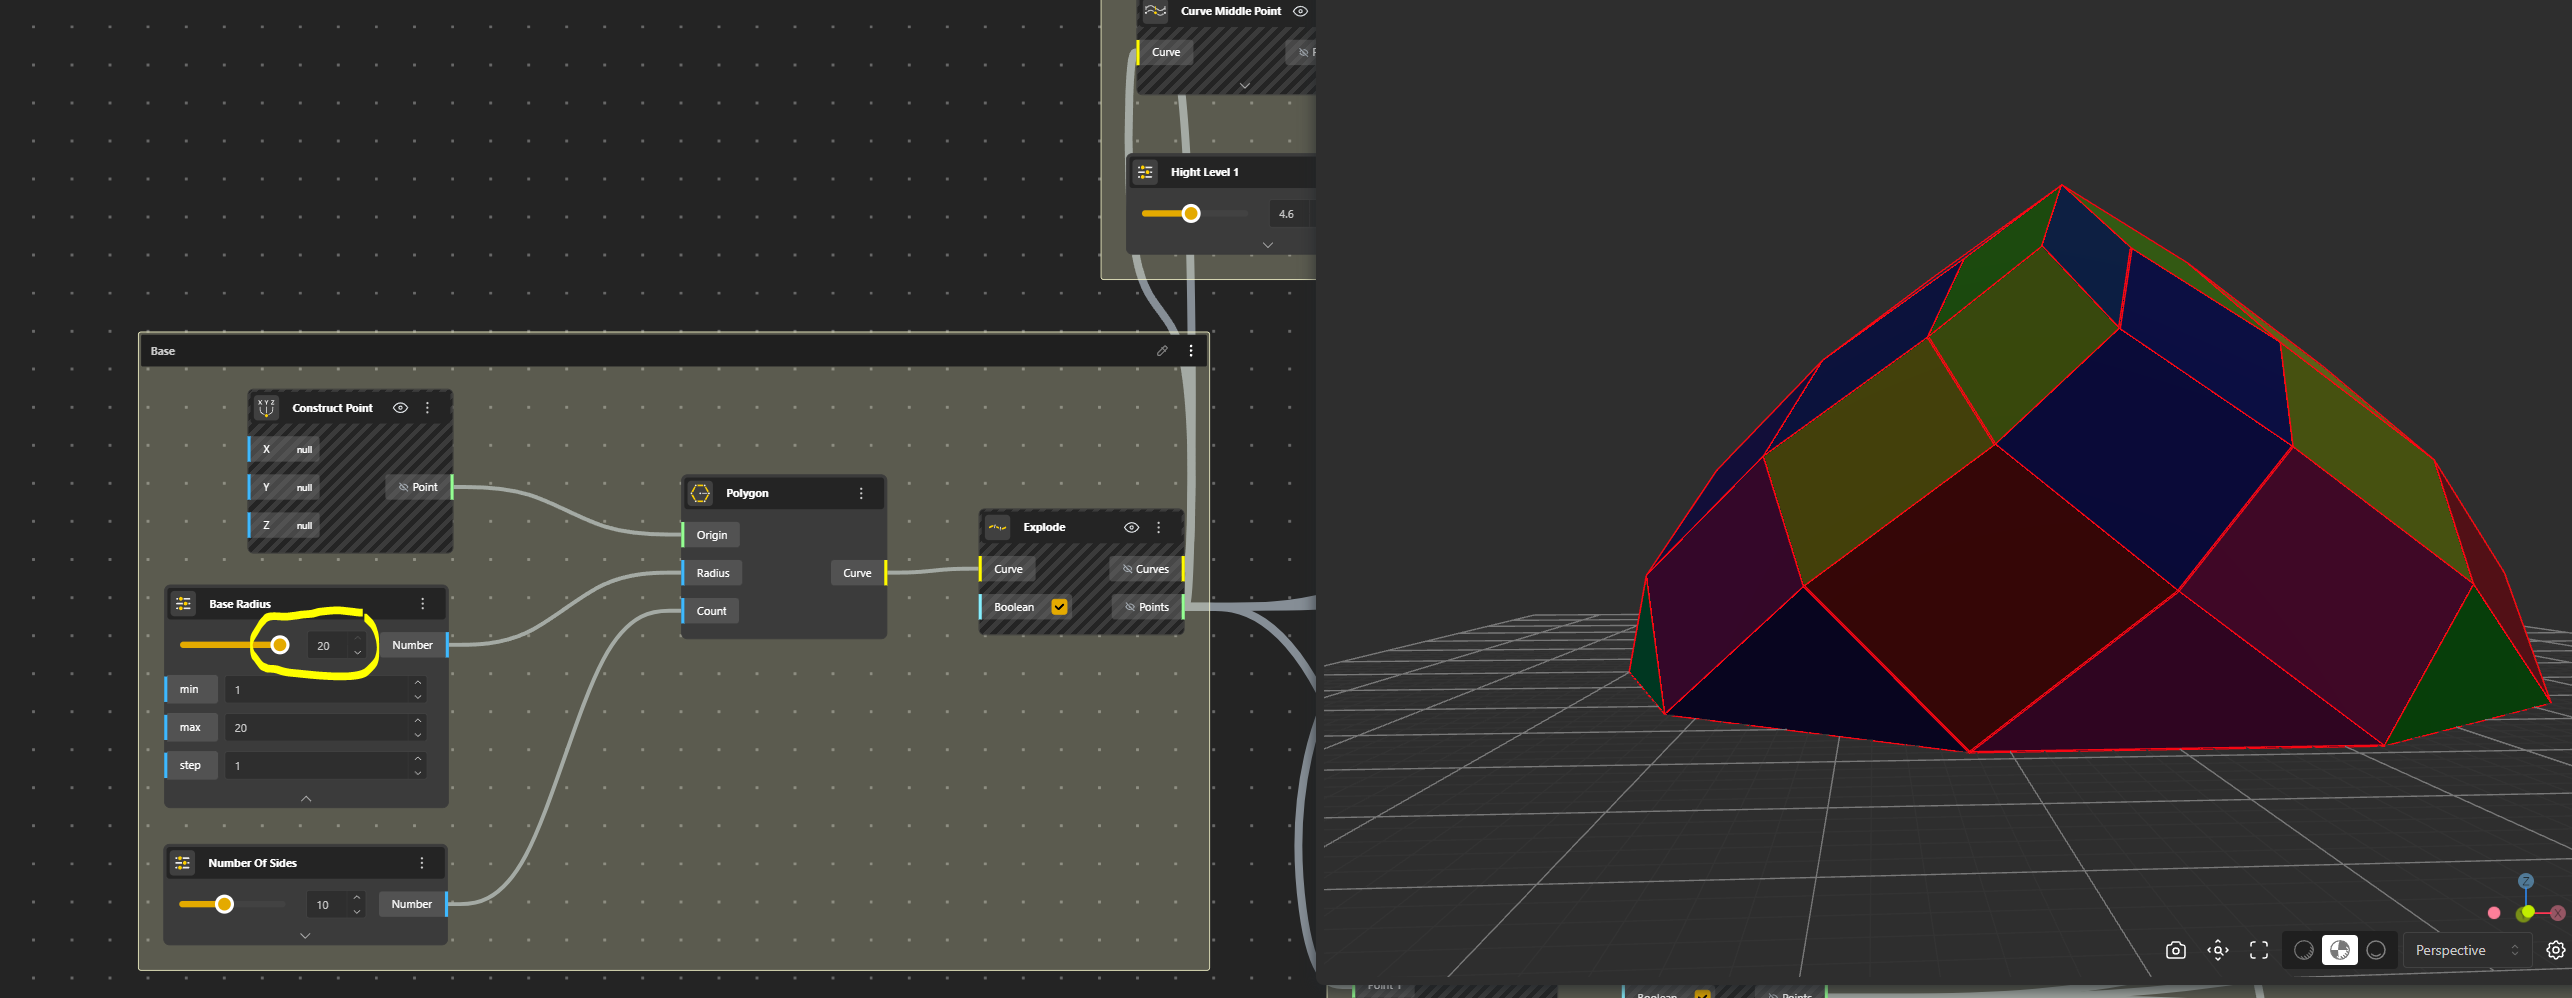
This is Radius 10, number of sides 10
This is Radius 20, number of sides 10
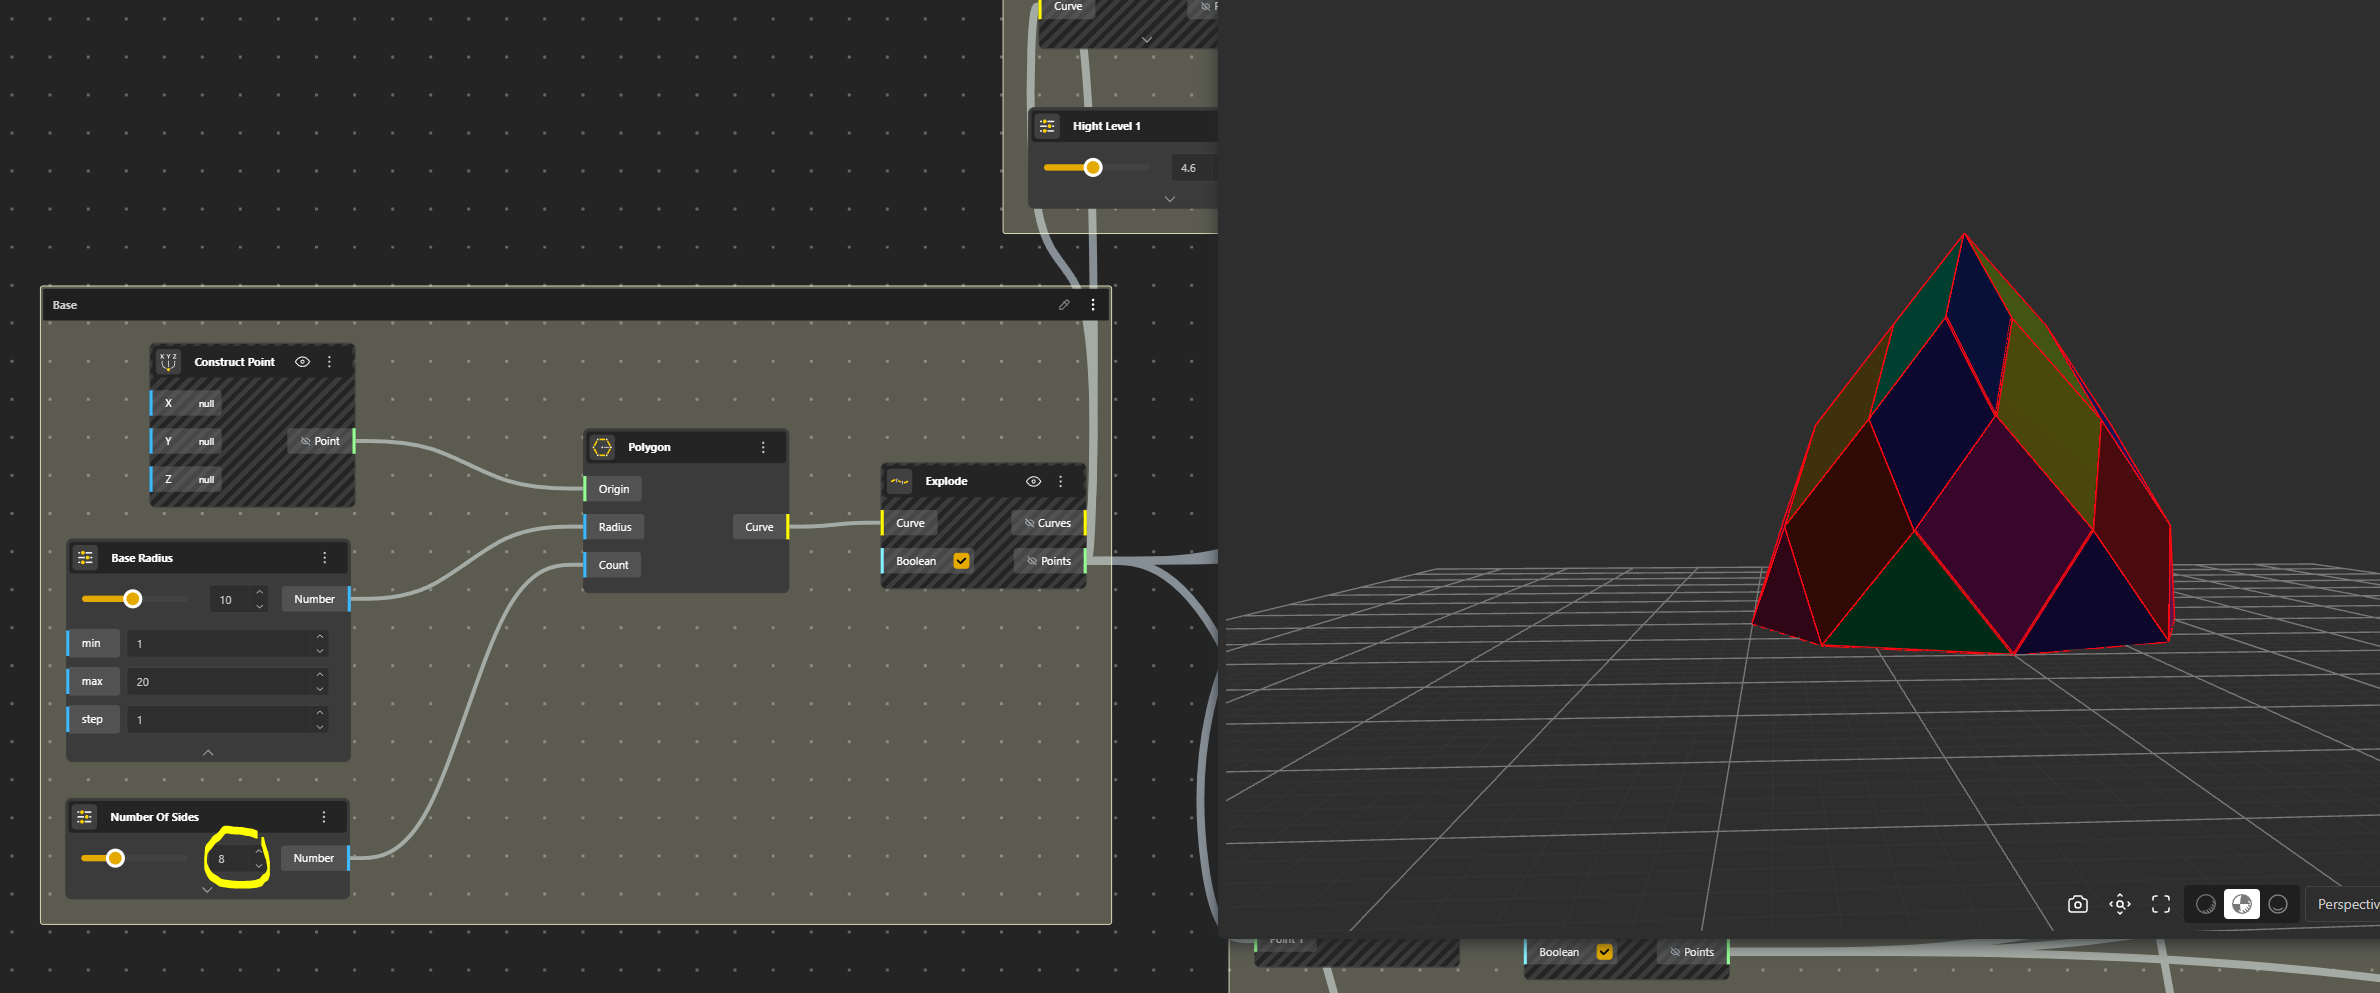
This is Radius 10, number of sides 6
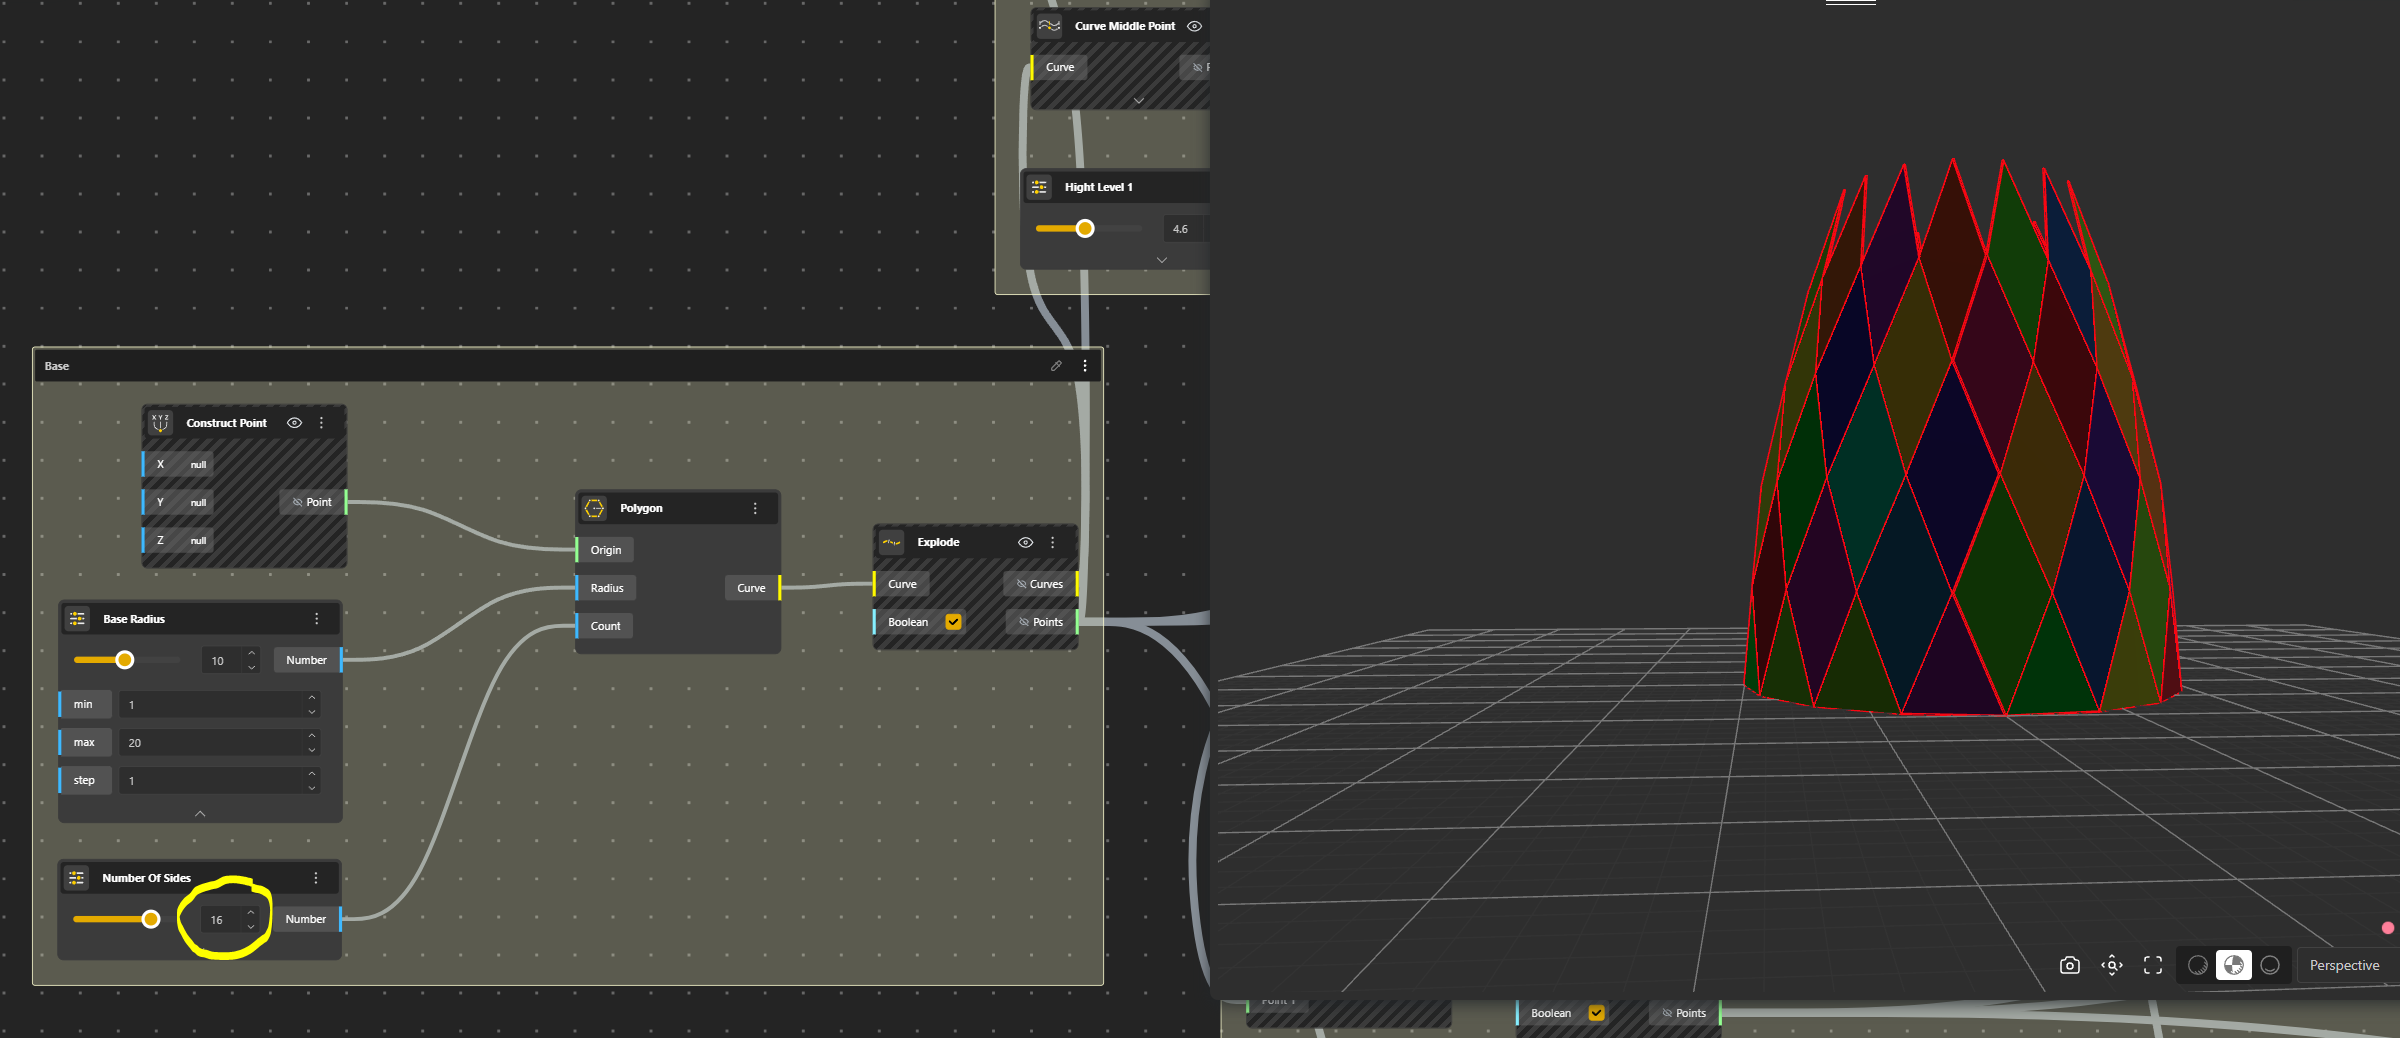
For a more important number of sides, we shall increase the number of levels.
This is Radius 10, number of sides 16
If anyone knows how to repeat a pattern depending on a certain factor (like the number of sides) please tell me.
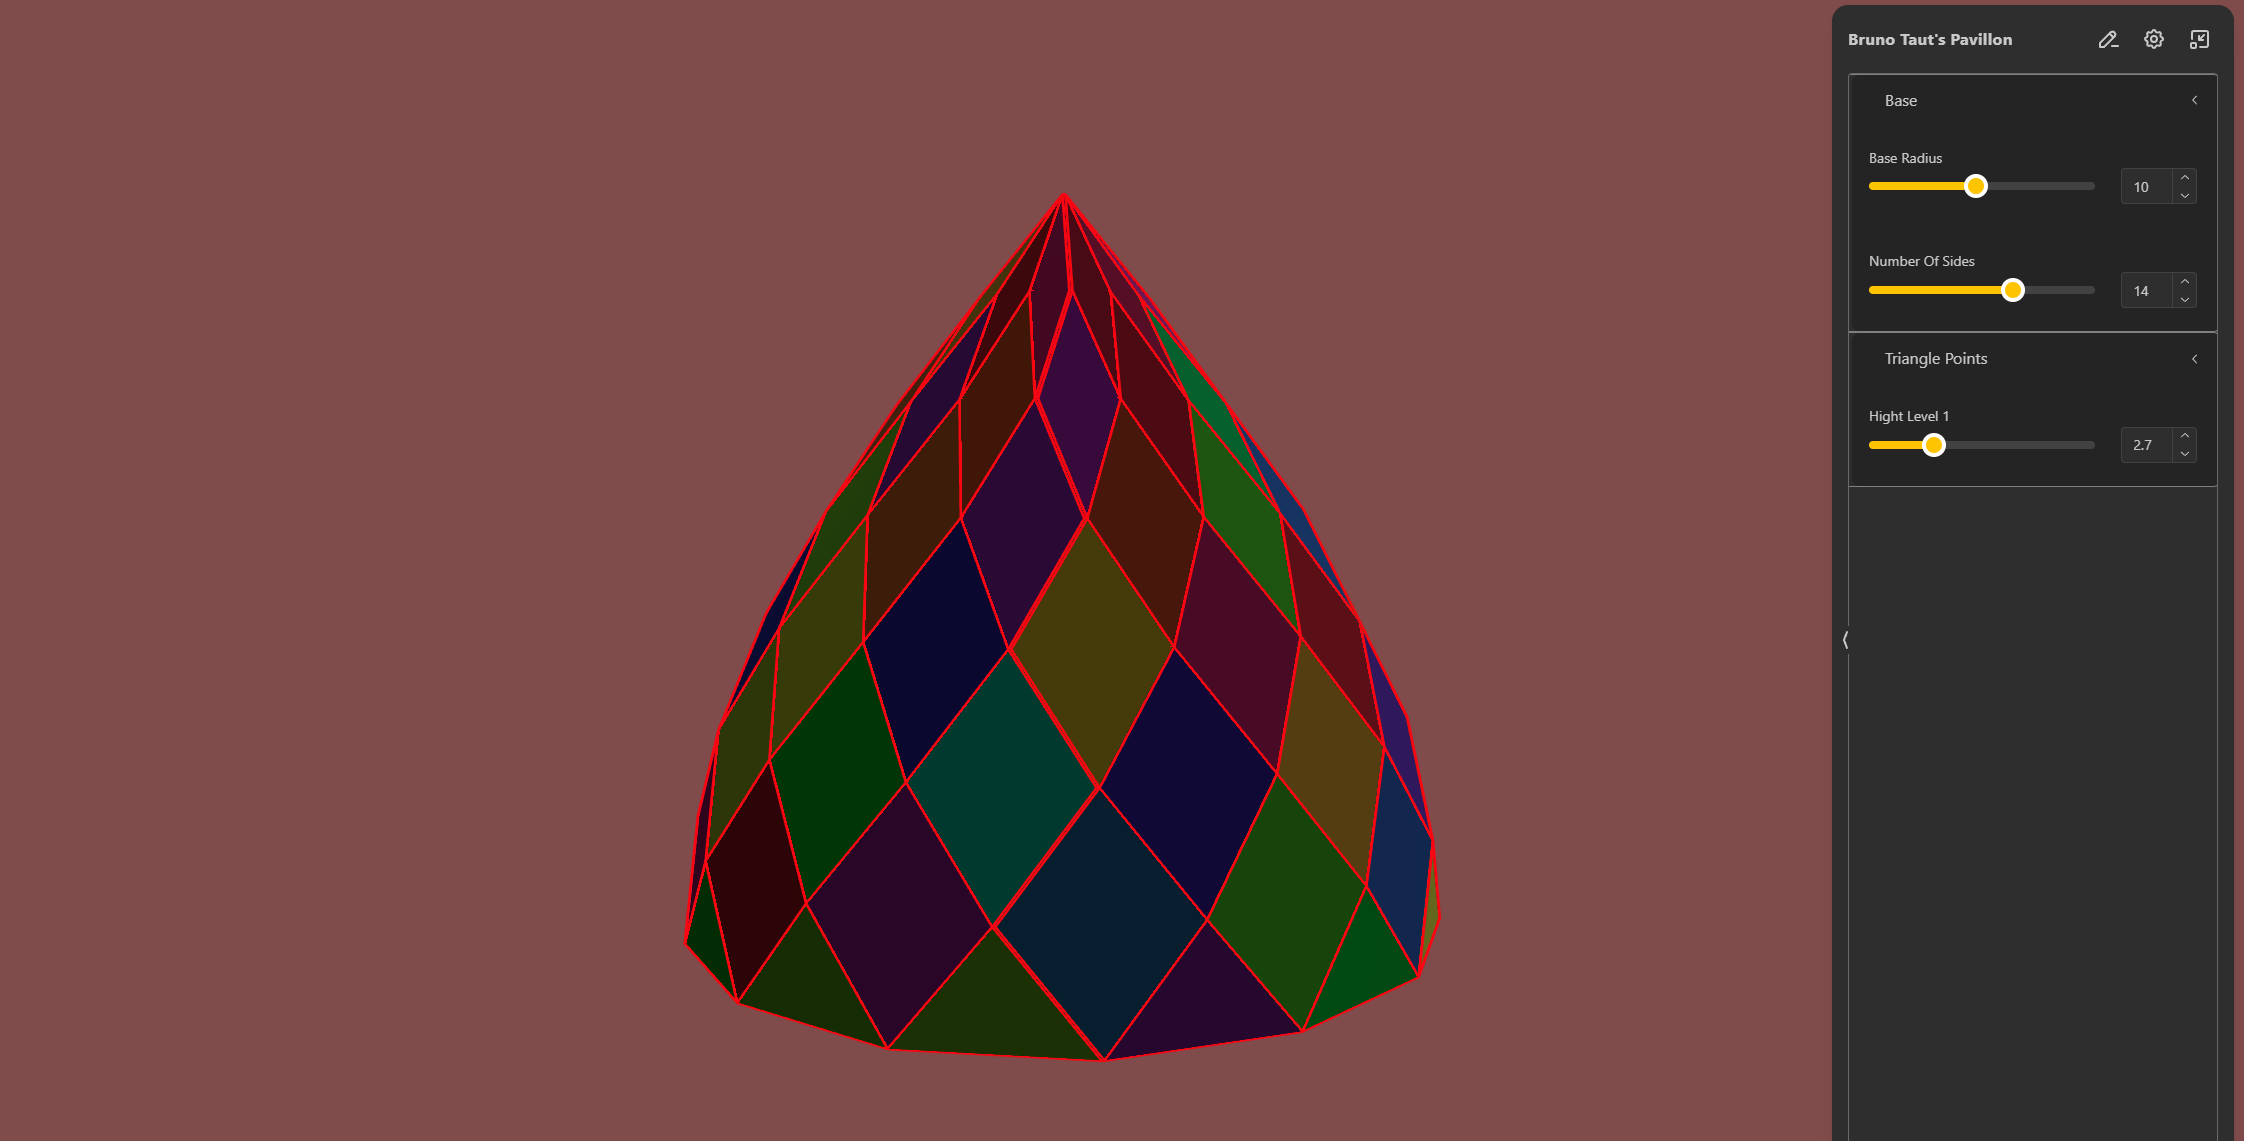
The real pavilion has 14 sides.
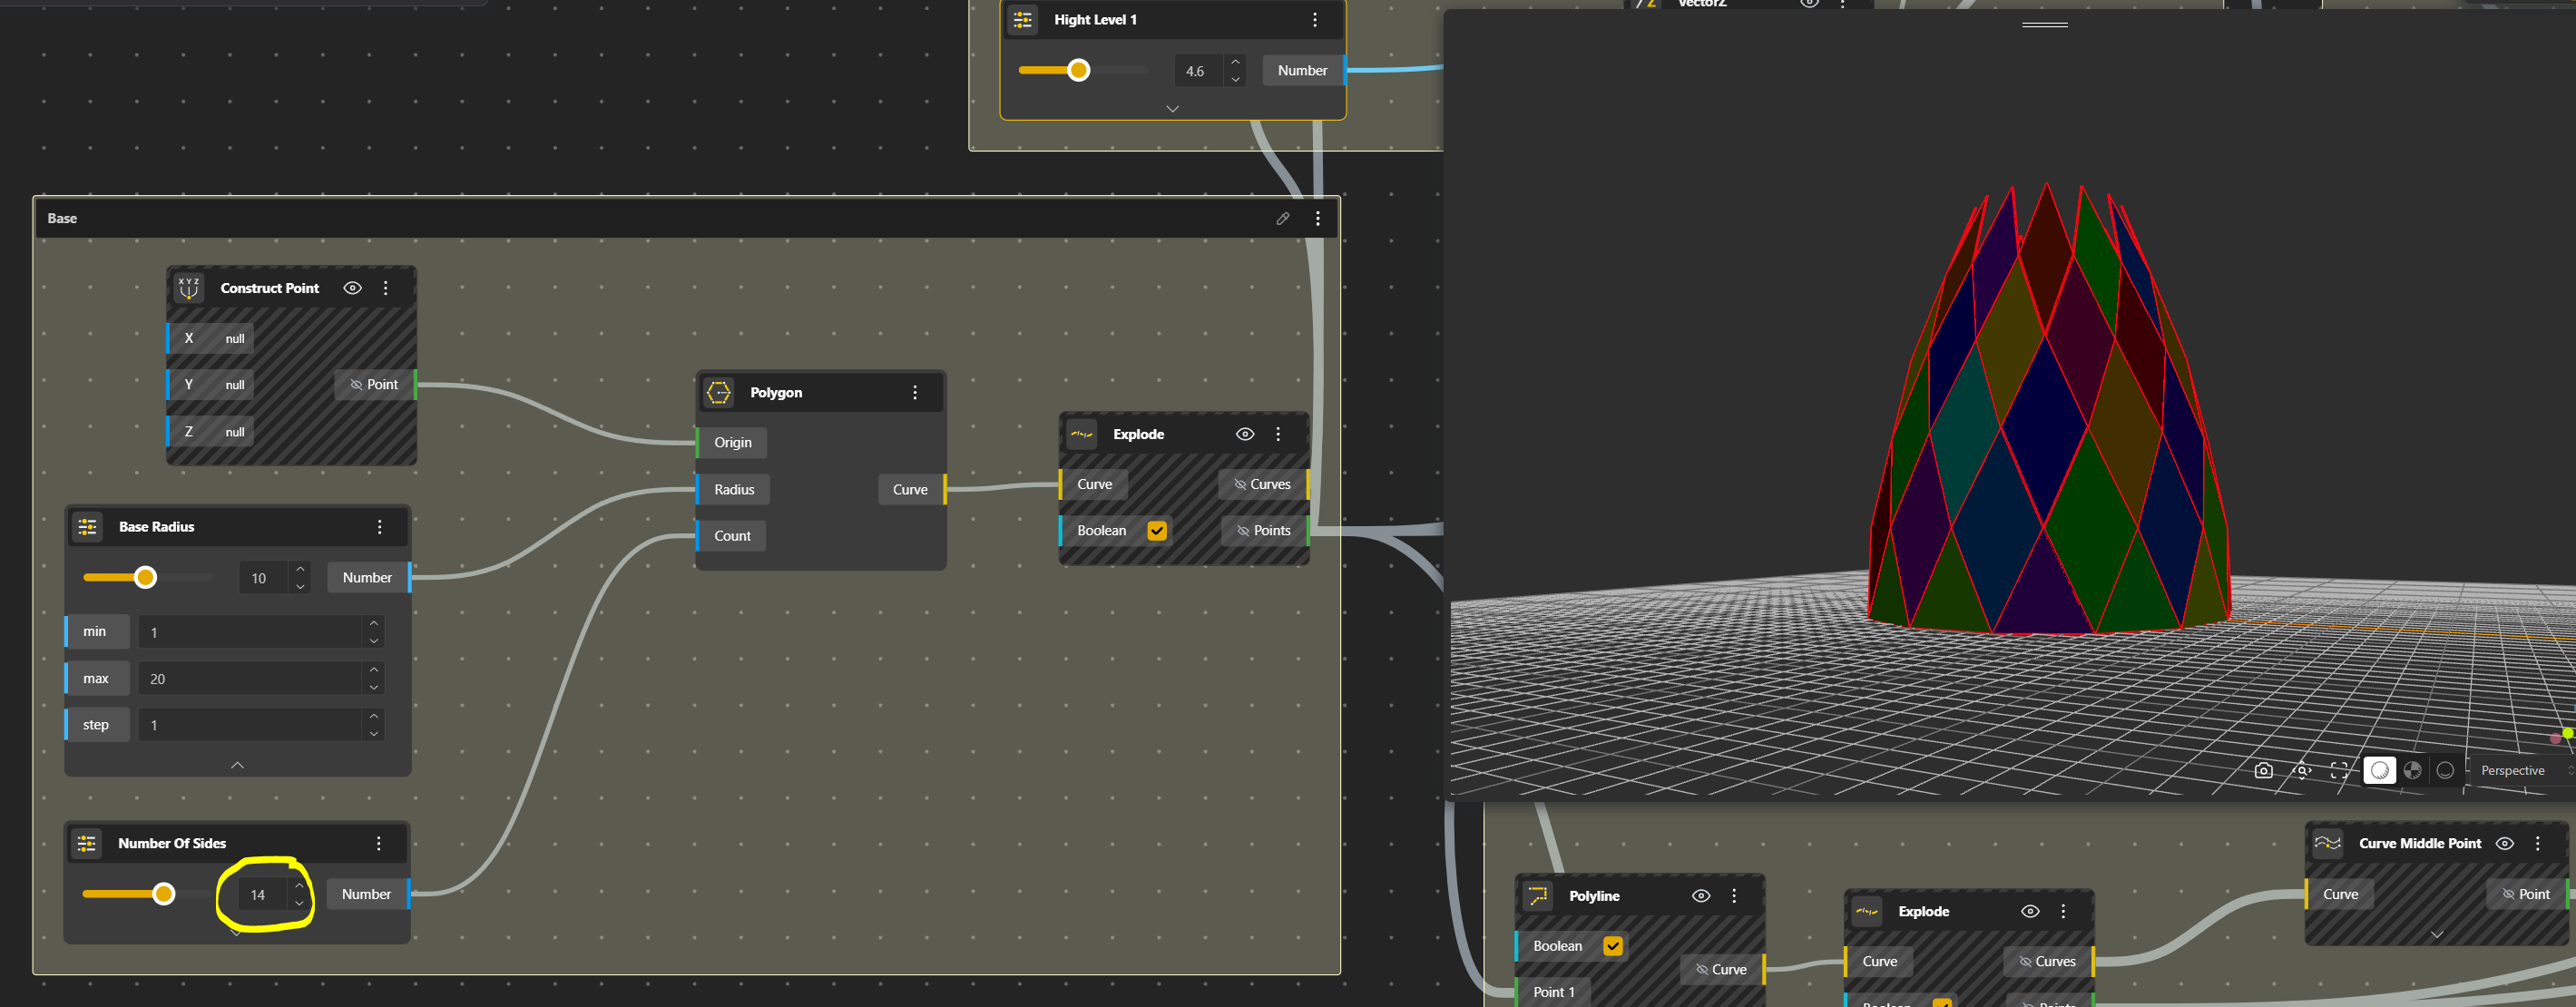
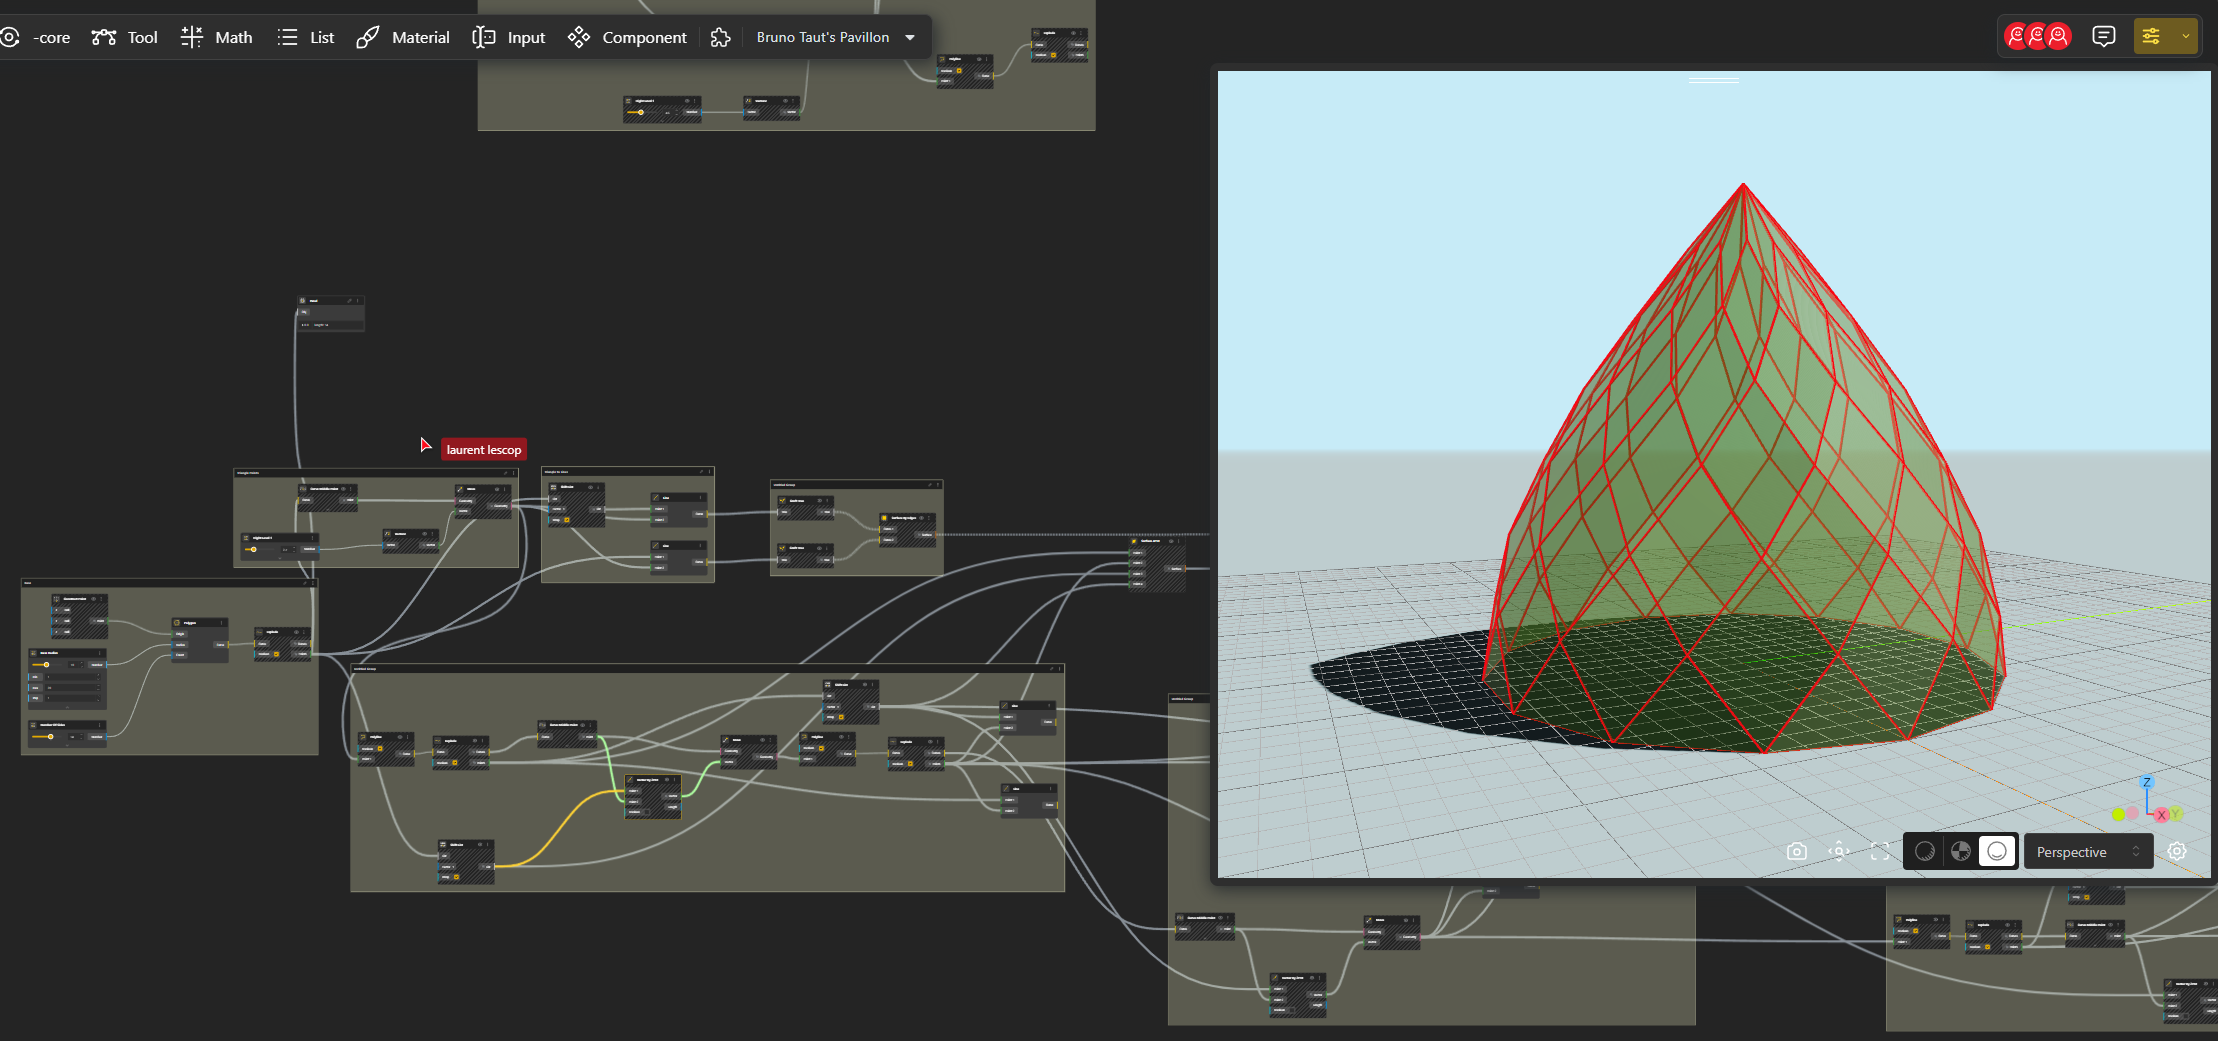
But the bulb is not the same. Let’s change the height of the first row…
That’s better, some row will be added. Of course, as it is a parametric model, it’s possible to play around with the parameters.
Two more pattern have been added to fit this height.
The configurator allows to play with the dimensions, great great tool in Beegraphy
Play with it :
https://beegraphy.com/embed/64e39a29d4193068ea0668c6
Conclusion
We’ve here a magic shape, very pleasant to view, hard to imagine how it has been drawn and built. Just for the fun of it, an article (Nielsen D, Kumarasuriyar A. The lily, client and measure of Bruno Taut’s Glashaus. Architectural Research Quarterly. 2014;18(3):257-266. doi:10.1017/S1359135514000608) presents the “geometric seed” to draw the pavilion…wow….
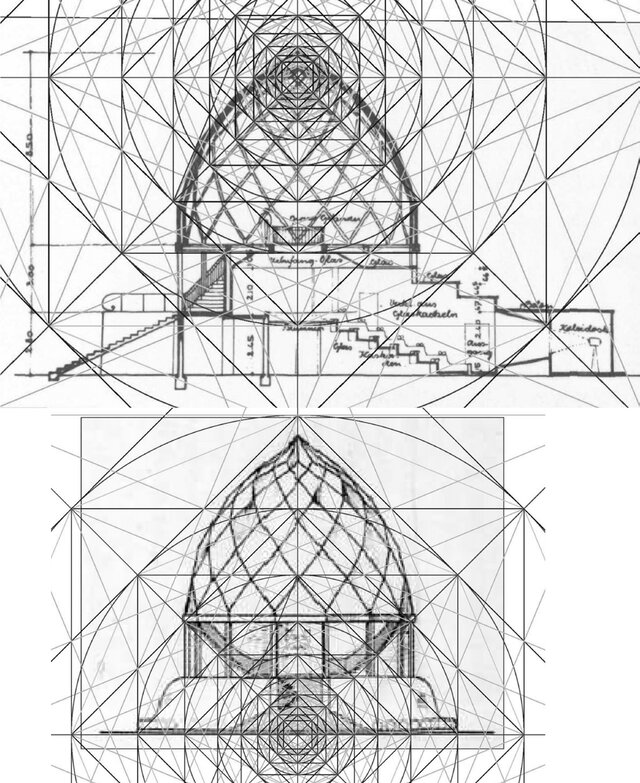
Overlaying the scaled ‘geometric seeds’ onto a section and elevation of the Glashaus. by David Nielsen
See also : https://visuallexicon.wordpress.com/2017/10/03/glass-pavilion-bruno-taut/